Review
. 2009 Jan;75(1):14-24.
doi: 10.1002/cyto.a.20674.

Mouse hematopoietic stem cell identification and analysis

Affiliations
Review

Mouse hematopoietic stem cell identification and analysis

Grant A Challen et al. Cytometry A. 2009 Jan.

Abstract

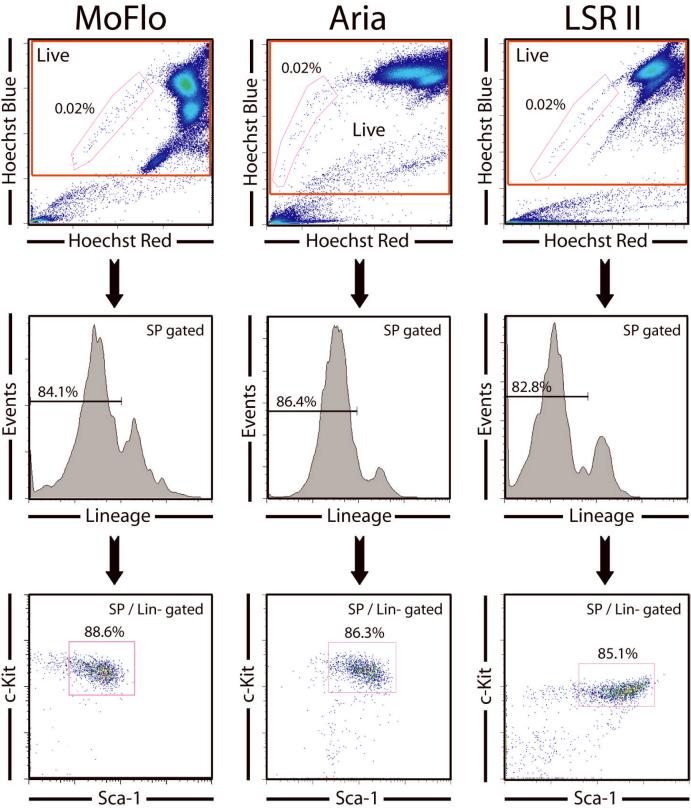
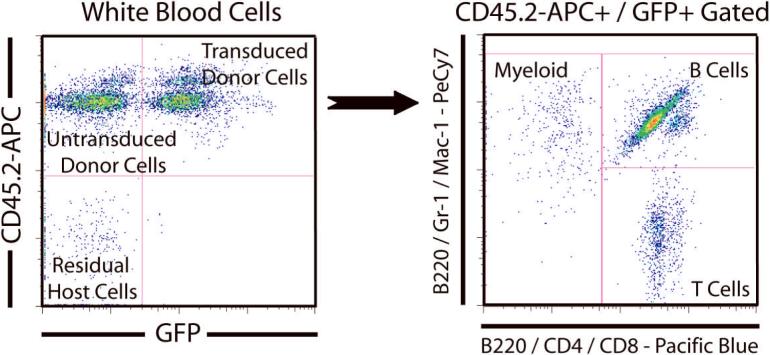
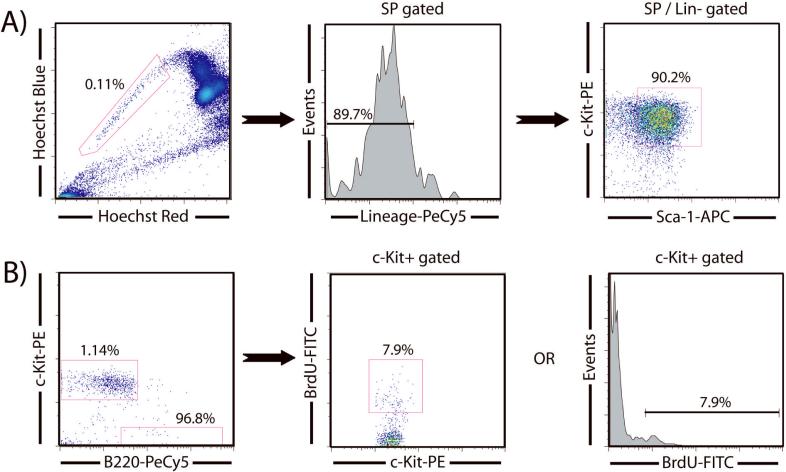
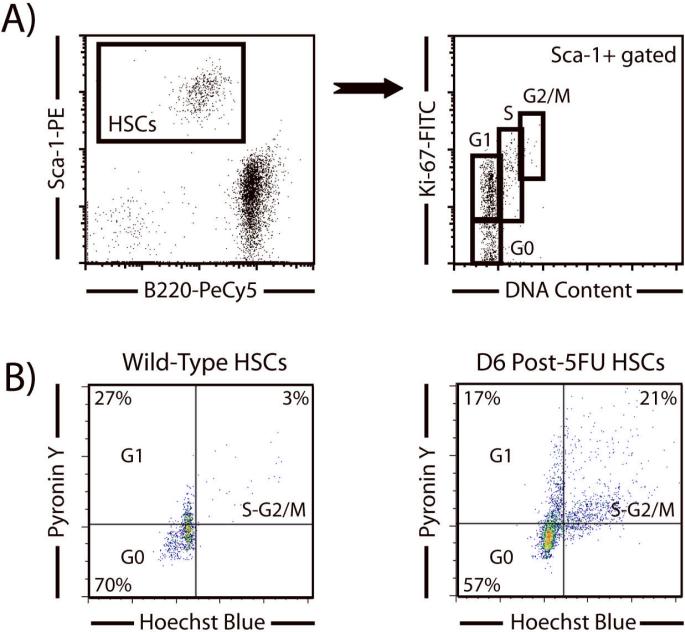
Hematopoietic stem cells (HSCs) remain by far the most well-characterized adult stem cell population both in terms of markers for purification and assays to assess functional potential. However, despite over 40 years of research, working with HSCs in the mouse remains difficult because of the relative abundance (or lack thereof) of these cells in the bone marrow. The frequency of HSCs in bone marrow is about 0.01% of total nucleated cells and approximately 5,000 can be isolated from an individual mouse depending on the age, sex, and strain of mice as well as purification scheme utilized. This prohibits the study of processes in HSCs, which require large amounts of starting material. Adding to the challenge is the continual reporting of new markers for HSC purification, which makes it difficult for the uninitiated in the field to know which purification strategies yield the highest proportion of long-term, multilineage HSCs. This report will review different hematopoietic stem and progenitor purification strategies and compare flow cytometry profiles for HSC sorting and analysis on different instruments. We will also discuss methods for rapid flow cytometric analysis of peripheral blood cell types, and novel strategies for working with rare cell populations such as HSCs in the analysis of cell cycle status by BrdU, Ki-67, and Pyronin Y staining. The purpose of this review is to provide insight into some of the recent experimental and technical advances in mouse hematopoietic stem cell biology.


Figures

Figure 1
Figure 1
Comparison of SPKLS profiles on different flow cytometers, demonstrating how key parameters used for hematopoietic stem cell identification and isolation by flow cytometry appears visually on different machines. No FSC / SSC gate is needed as dead cells and erythrocytes are excluded by the SP gate. Hoechst Red and Hoechst Blue parameters are examined first, and the voltages adjusted to place the majority of the cells in the upper right quadrant, allowing the SP cells to be central to the plot. The Hoechst red parameter also reveals propidium iodide staining, so dead cells can be excluded on this plot (they line up against the right side), as well as red blood cells (no Hoechst stain, so lower left corner), by drawing a rectangular gate. The SP can then be identified, as gated. In normal mouse bone marrow, an appropriately stained and gated SP will comprise around 0.01 to 0.3% of the live cell gate. The SP cells are then displayed for their lineage-marker profile in a histogram (the lineages markers being a cocktail of lineage-specific antibodies). The lineage-negative cells (usually around 85% of the SP) are then gated to a Sca-1 versus c-Kit plot with the double-positive population here taken to finally identify HSCs with the phenotype SP+ / Lineage- / Sca-1+ / c-Kit+ or SPKLS. If the SP has only a much lower percentage of Lineage-c-Kit+Sca-1+ cells than shown here, the Hoechst staining is likely to be poor.
Figure 2
Figure 2
CD150 as a hematopoietic stem cell marker and overlap with SPKLS staining. (A) Gating of cells SPKLS to a CD150 plot shows that approximately half of all SP cells express CD150. Heterogeneous expression of CD150 is seen in the SP with more CD150+ cells appearing lower in the tail of the SP. This can be further demonstrated by fractionating the SP into lower and upper SP showing that approximately 80% and 40% of these cells respectively are CD150+. (B) Backgating to determine where CD150+ cells fall in the SP. If a more generous CD150 gate is used, only approximately 45% of Lineage-CD150+ cells are SP cells, but if a more stringent CD150 gate is applied, this proportion increases to over 80%.
Figure 3
Figure 3
EPCR as a hematopoietic stem cell marker and overlap with SPKLS staining. (A) Co-staining shows that almost all SPKLS cells are also EPCR+. (B) Backgating to determine where EPCR+ cells fall in the SP. The intensity of EPCR staining does not effect SP distribution. If a generous Lineage-EPCR+ gate is used, ~6% of these cells are SP cells, but if a more stringent EPCR gate is applied, the proportion of SP cells only increases mildly to approximately 8% (data not shown).
Figure 4
Figure 4
Separation of hematopoietic progenitor populations by flow cytometry. (A) LT-HSC, ST-HSC, and MPP gating scheme. SP cells are gated to KLS as described for Figure 1, and shown here displayed in red on a CD34 / Flk-2 plot; the SPKLS are negative for both of these markers (the Hoechst-stained cells here have been previously magnetically enriched for Sca-1 to increase the overall proportion to 0.14%). The non-SP population, also shown gated on the Hoechst plot, is also taken through a KLS selection (not shown), then displayed for CD34 and Flk2. The KLS-Flk2+CD34+ cells are multi-potential progenitors (MPP), and the Flk2-CD34+ cells are considered short-term (ST) HSC. Thus, all three of these populations can be readily sorted from one sample. (B) Gating scheme for the common myeloid progenitor (CMP), megakaryocyte-erythrocyte progenitors (MEPs) and granulocyte-macrophage progenitors (GMPs). (C) Gating scheme for the common lymphoid progenitor (CLP).
Figure 5
Figure 5
Rapid flow cytometric analysis of peripheral blood of mice transplanted with HSCs transduced with MSCV-GFP retrovirus. For this analysis, red blood cells are depleted or lysed, and the remainder gated out on a FSC/SSC plot. Then viable white blood cells are gated and displayed on a CD45.2-APC versus GFP dot-plot. Progeny of donor HSC (CD45.2) can be discriminated from recipient cells (CD45.1) by CD45 alleles, and the donor HSCs that were successfully transduced to over-express a test gene are GFP+. The CD45.2+ / GFP+ population can then be gated to a PeCy7 versus Pacific Blue dot-plot to analyze distribution of the blood lineages. Myeloid cells are labeled with Gr1 and Mac-1 conjugated to PeCy7. T-cells are labeled with CD4 and CD8 antibodies conjugated to Pacific Blue (Pac-Blue). By labeling B cells with both B220-PeCy7 and B220-Pac-Blue, all major hematopoietic lineages can be displayed simultaneously on the same plot. The B cells are the double positive population, the myeloid cells (Gr-1+, Mac-1+) are the PeCy7+PacBlue- population, while the T cells (CD4+, CD8+) are the PeCy7-PacBlue+ population. If we were analyzing transplanted mice in which the GFP was not used to follow retroviral marking, we typically use CD45.1-FITC to track the recipient cells in addition to the donor cells.
Figure 6
Figure 6
Analysis of HSCs turnover by BrdU labeling using flow cytometry. (A) HSCs from mice injected with BrdU are purified from Sca-1-enriched bone marrow (increasing the proportion of SP cells 10-fold) and then fixed and permeabilized overnight. (B) Reanalysis of the sorted cells following intracellular staining for BrdU. A PE versus PeCy5 dot-plot allows for discrimination between sorted HSCs and carrier B cells (the majority of carrier cells are lined up against the x-axis). The HSCs can then be gated to either a stem cells marker versus BrdU dot-plot or to a histogram to determine BrdU incorporation.
Figure 7
Figure 7
Cell cycle reanalysis of purified SPKLS cells by Ki-67 and Pyronin Y. (A) Using the carrier cell technique, SPKLS cells were purified then fixed and permeabilized for Ki-67 staining. On the reanalysis, HSCs (Sca-1+B220-) were easily identified from carrier cells (Sca-1-B220+) and gated to show a distribution of Ki-67 versus DNA content using propidium iodide. This plot allows discrimination of the various stages of cell cycle of the HSC population. (B) Analysis of HSC cell cycle status by Pyronin Y staining. As above, SPKLS were sorted into carrier cells and then both populations were stained for Pyronin Y analysis. On reanalysis, HSCs are gated away from carrier cells to a Hoechst versus Pyronin Y plot which shows the different stages of cell cycle. The use of this assay is clearly demonstrated when comparing normal HSCs to those which have been stimulated with the chemotherapeutic agent 5-flurouracil (5-FU) which brings them out of quiescence and into cell activation programs. In normal HSCs, the vast majority are resting in the G0 stage, while six days after 5-FU stimulation a much higher proportion are actively engaged in the cell cycle in S/G2-M.

References

    1. Goodell MA, Brose K, Paradis G, Conner AS, Mulligan RC. Isolation and functional properties of murine hematopoietic stem cells that are replicating in vivo. J Exp Med. 1996;183:1797–1806. - PMC - PubMed
    1. Adolfsson J, Borge OJ, Bryder D, Theilgaard-Monch K, Astrand-Grundstrom I, Sitnicka E, Sasaki Y, Jacobsen SE. Upregulation of Flt3 expression within the bone marrow Lin(-)Sca1(+)c-kit(+) stem cell compartment is accompanied by loss of self-renewal capacity. Immunity. 2001;15:659–669. - PubMed
    1. Kiel MJ, Radice GL, Morrison SJ. Lack of evidence that hematopoietic stem cells depend on N-cadherin-mediated adhesion to osteoblasts for their maintenance. Cell Stem Cell. 2007;1:204–217. - PubMed
    1. Dykstra B, Ramunas J, Ken D, McCaffrey L, Szumsky E, Kelly L, Farn K, Blaylock A, Eaves C, Jervis E. High-resolution video monitoring of hematopoietic stem cells cultured in single-cell arrays identifies new features of self-renewal. Proc Natl Acad Sci USA. 2006;103:8185–8190. - PMC - PubMed
    1. Balazs AB, Fabian AJ, Esmon CT, Mulligan RC. Endothelial protein C receptor (CD201) explicitly identifies hematopoietic stem cells in murine bone marrow. Blood. 2006;107:2317–2321. - PMC - PubMed

Publication types