. 2009 Feb;40(2):199-206.
doi: 10.1016/j.mcn.2008.10.005. Epub 2008 Nov 5.

Enhancement of the endosomal endocytic pathway increases quantal size

Affiliations

Enhancement of the endosomal endocytic pathway increases quantal size

Yulia Akbergenova et al. Mol Cell Neurosci. 2009 Feb.

Abstract

We combined recordings of spontaneous quantal events with electron microscopy analysis of synaptic ultrastructure to demonstrate that the size of a neurosecretory quantum increases following an activation of the endosomal endocytic pathway. We reversibly activated the endosomal endocytic pathway in Drosophila motor boutons by application of high K+ solution. This treatment produced the formation of numerous cisternae, vacuoles and enlarged vesicles. Spontaneous quantal events recorded immediately after the cessation of high K+ application were significantly enlarged, and this increase in quantal size was reversed after a 10 minute resting period. Actin depolymerization produced by latrunculin B pretreatment inhibited both the formation of endosome-like structures and the increase in quantal size. Loading the preparations with the dye FM1-43 followed by photoconversion of the dye combined with electron microscopy analysis revealed that the observed cisternae are likely to be the product of both bulk membrane retrieval and vesicle fusion.


Figures
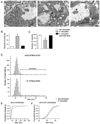
Fig. 1
Fig. 1. High K+ stimulation reversibly activates the endosomal endocytic pathway
(A) Representative electron micrographs of Ib boutons at rest (left), immediately after high K+ stimulation (center), and after a 10 minute delay following high K+ stimulation (right). Scale bar: 200 nm. (B) The number of endosome-like cisternae significantly and reversibly increases after high K+ stimulation. (C) The number of vesicles significantly and reversibly decreases after high K+ stimulation. Asterisks indicate significant difference (p<0.05). (D) Distributions of the diameters of all the membranous structures, including vesicles and cisternae, for non stimulated (top) and high K+ stimulated (bottom) boutons. (E) Cumulative frequency distributions of the diameters of all the membranous structures, including vesicles and cisternae, for non stimulated (solid line) and high K+ stimulated (dotted line) boutons. (F) Cumulative frequency distributions of the diameters of vesicles (cisternae excluded) for non stimulated and high K+ stimulated boutons. The distributions are significantly different (p<0.01 according to Kolmogorov–Smirnov test).
Fig. 2
Fig. 2. Quantal size increases following high K+ application
(A) A string of Ib boutons (left). An arrow points to the bouton from which recordings were taken (right). (B) Representative recordings of mEPSPs before (top) and after (bottom) high K+ stimulation. (C–E) mEPSP frequency (C) amplitude (D) and area (E) transiently increases after high K+ stimulation. Asterisks indicate significant difference (p<0.05). (F) Distribution of mEPSP areas demonstrates a large proportion of enlarged mEPSPs after high K+ stimulation. (G) Cumulative frequency distributions of mEPSP areas for non-stimulated (solid line) and high K+ stimulated (dotted line) synapses. Frequency distributions are significantly different (p<0.01, Kolmogorov–Smirnov test).
Fig. 3
Fig. 3. Disruption of actin polymerization by latrunculin B inhibits the formation of cisternae and the increase in quantal size
(A) A representative micrograph of latrunculin B treated and high K+ stimulated bouton. Scale bar: 200 nm. (B) Latrunculin B treatment inhibited cisternae formation in high K+ stimulated boutons. An asterisk indicates that significantly (p<0.05) less cisternae were observed in latrunculin B treated high K+ stimulated treated preparations (black) compared to untreated high K+ stimulated preparations (gray). (C, D) No significant changes in mEPSP area (C) or amplitude (D) were observed in latrunculin B treated high K+ stimulated preparations, compared to untreated and non-stimulated preparations.
Fig. 4
Fig. 4. Statistical analysis of the distributions of quantal size and vesicle volume
(A) The slight enlargement of synaptic after high K+ application (solid squares — control, solid triangles — after high K+) cannot account for the noticeable enlargement in quantal size (open squares — control, open triangles — after high K+). Size unit corresponds to the whole range of the control vesicle distribution. (B) After high K+ application, the volume of all the membranous structures, including vesicles and cisternae, has higher variability than the quantal size. The distributions of vesicle/cisternae volume and quantal size do not match. The distribution of vesicle/cisternae volume predicts a noticeable proportion of giant quantal, which are not observed. (C) After high K+ application, the distribution of the volume of vesicles and cisternae of up to 80 nm diameter, provides a reasonably good match to the distribution of quantal size.
Fig. 5
Fig. 5. FM1–43 photoconversion reveals different patterns of cisternae formation
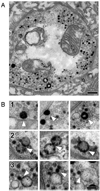
(A) A representative micrograph of a bouton loaded with the dye FM1–43 by a 1.5 minute high K+ stimulation after the dye was photoconverted into an electron dense product. Both dark (stained with the dyes) and light translucent vesicles and cisternae are observed. Scale bar: 200 nm. (B) Gallery of representative micrographs demonstrating different staining patterns in cisternae after the dye photoconversion. Cisternae are marked with arrows. (1) Cisternae labeled completely and evenly located close to the presynaptic membrane are likely to be produced by the bulk membrane uptake. (2) Cisternae unevenly labeled are likely to be produced by the fusion of labeled and unlabeled vesicles. (3) Fusion of evenly labeled vesicles with unlabeled or unevenly labeled cisternae.
Fig. 6
Fig. 6. A proportion of the labeled cisternae increases upon a more prolonged stimulation
(A) A representative micrograph of a bouton loaded with the dye FM1–43 by a 5 minute high K+ stimulation after the dye was photoconverted into an electron dense product. The majority of the vesicles and cisternae are labeled. Scale bar: 200 nm. (B) A proportion of labeled (gray portions of the bars) cisternae significantly (p<0.05) increased as the stimulation time increased, while the total number of cisternae remained unchanged. Asterisks indicate significant difference (p<0.05).
Fig. 7
Fig. 7. The endosomal endocytic pathway is Ca2+-dependent, but action potential stimulation is not as efficient in its activation as high K+ applications
(A) A representative micrograph of the bouton which was stimulated by the application of high K+ and low Ca2+ (0.2 mM) solution (top); a representative micrograph of the bouton which was stimulated by repetitive action potentials (50 Hz frequency for 15 min, bottom). Some cisternae are observed, but they are not abundant. (B) The simulation by high K+ and low Ca2+ solution or prolonged stimulation by repetitive action potentials (at 10 Hz or 50 Hz frequency) fails to produce a marked increase in the number of cisternae. The increase observed at the 50 Hz stimulation is statistically significant (p<0.05 indicated by an asterisk), although modest.

References

    1. Atwood HL, Govind CK, Wu CF. Differential ultrastructure of synaptic terminals on ventral longitudinal abdominalmuscles in Drosophila larvae. J. Neurobiol. 1993;24:1008–1024. - PubMed
    1. Bekkers JM, Stevens CF. Quantal analysis of EPSCs recorded from small numbers of synapses in hippocampal cultures. J. Neurophysiol. 1995;73:1145–1156. - PubMed
    1. Bekkers JM, Richerson GB, Stevens CF. Origin of variability in quantal size in cultured hippocampal neurons and hippocampal slices. Proc. Natl. Acad. Sci. U. S. A. 1990;87:5359–5362. - PMC - PubMed
    1. Bykhovskaia M. Making quantal analysis more convenient, fast, and accurate: user-friendly software QUANTAN. J. Neurosci. Methods. 2008;168:500–513. - PMC - PubMed
    1. Coggins MR, Grabner CP, Almers W, Zenisek D. Stimulated exocytosis of endosomes in goldfish retinal bipolar neurons. J. Physiol. 2007;584:853–865. - PMC - PubMed

Publication types

MeSH terms

LinkOut - more resources