. 2009 Feb 15;44(4):1259-66.
doi: 10.1016/j.neuroimage.2008.10.029. Epub 2008 Nov 5.

Susceptibility contrast in high field MRI of human brain as a function of tissue iron content

Affiliations

Susceptibility contrast in high field MRI of human brain as a function of tissue iron content

Bing Yao et al. Neuroimage. .

Erratum in

  • Neuroimage. 2012 Sep;62(3):2173

Abstract

Magnetic susceptibility provides an important contrast mechanism for MRI. Increasingly, susceptibility-based contrast is being exploited to investigate brain tissue microstructure and to detect abnormal levels of brain iron as these have been implicated in a variety of neuro-degenerative diseases. However, it remains unclear to what extent magnetic susceptibility-related contrast at high field relates to actual brain iron concentrations. In this study, we performed susceptibility weighted imaging as a function of field strength on healthy brains in vivo and post-mortem brain tissues at 1.5 T, 3 T and 7 T. Iron histology was performed on the tissue samples for comparison. The calculated susceptibility-related parameters R(2)(*) and signal frequency shift in four iron-rich regions (putamen, globus pallidus, caudate, and thalamus) showed an almost linear dependence (r>or=0.90 for R(2)(*); r>or=0.83 for phase, p<0.01) on field strength, suggesting that potential ferritin saturation effects are not relevant to susceptibility-weighted contrast for field strengths up to 7 T. The R(2)(*) dependence on the putative (literature-based) iron concentration was 0.048 Hz/T/ppm. The histological data from brain samples confirmed the linear dependence of R(2)(*) on field strength and showed a slope against iron concentration of 0.0099 Hz/T/ppm dry-weight, which is equivalent to 0.05 Hz/T/ppm wet-weight and closely matched the calculated value in vivo. These results confirm the validity of using susceptibility-weighted contrast as an indicator of iron content in iron-rich brain regions. The absence of saturation effects opens the way to exploit the benefits of MRI at high field strengths for the detection of iron distributions with high sensitivity and resolution.


Figures

Figure 1
Figure 1
Four iron-rich ROIs and a ROI containing Cerebrospinal fluid (CSF) were drawn on the MPRAGE images at 1.5 T, 3 T and 7 T. The ROIs are: Putamen (PU), Caudate Nucleus (CA), Globus Pallidus (GP) and Thalamus (TH).
Figure 2
Figure 2
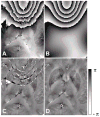
Illustration of the phase unwrapping procedure. (A) The original wrapped phase image in basal ganglia area at 7 T, TE = 23.2 ms. (B) The fitted macroscopic phase image using an eighth-order polynomial function. (C) Subtraction of fitted phase background from the original wrapped phase. (D) Unwrapped phase image after trim the pixel values into range [−p, p].
Figure 3
Figure 3
Comparison of the Gradient Echo images (A) and the calculated R2* images (B) at different field strengths. The figure shows the images of one subject (TR = 1000 ms, flip angle = 60°, resolution = 0.94 × 0.94 mm2, TE = 57.0/35.9/30.0 ms for 1.5/3/7 T, respectively). 7 T images have a much better SNR and show finer structural details. R2* values (Hz) increase with field strength (Note that different scales are used for each field strength for better demonstration). The box in (A) indicates the zoomed-in region illustrated in Figure 5.
Figure 4
Figure 4
(A) Individual subject R2* values as a function of field strength in the four ROIs (refer to Figure 1). The different line colors indicate the different subjects. (B) Group averaged R2* values against field strength in the four ROIs. The error bars indicate the standard errors.
Figure 5
Figure 5
Comparison of phase maps at different field strengths (basal ganglia area, see box in Figure 3). Greater phase contrast was observed in the higher field strength images. The phase value is shown in units of Hertz, with respect to the phase value of CSF in the lateral ventricle at the corresponding field strength.
Figure 6
Figure 6
(A) Individual frequency shifts as a function of field strength in the four ROIs (refer to Figure 1). The different line colors indicate the different subjects. (B) Group averaged frequency shifts against field strength in the four ROIs. Error bars indicate the standard error.
Figure 7
Figure 7
R2* and frequency shift (B) change as a function of iron concentration at field strengths of 1.5, 3, and 7 T, respectively. The dots are the data points from each ROI in each individual subject; the solid lines indicate the linear fits. The iron concentration was calculated from experimental equations (1) – (3) with respect to tissue wet weight.
Figure 8
Figure 8
R2* (A) and frequency shift (B) rates of change with field strength as a function of iron concentration. The dots are the data points from each ROI in each individual subject; the solid line indicates the linear fit. The iron concentration was calculated from experimental equations (1) – (3) with respect to tissue wet weight.
Figure 9
Figure 9
(A) R2* value as a function of field strength in each ROI for the two brain tissue specimens. The different line colors indicate the different ROIs. The solid lines and dotted lines represent different brain tissues, respectively. Note the ROI CC (corpus callosum) is only measured in brain tissue A. (B) R2* rate of change with field strength as a function of iron concentration in the brain tissues. The dots are the data points from each ROI in the two brain tissues; the solid line indicates the linear fit. The iron concentration was measured with respect to tissue dry weight. It has different scale from Figures 7 and 8 (see discussion for details).

References

    1. Abduljalil AM, Schmalbrock P, Novak V, Chakeres DW. Enhanced gray and white matter contrast of phase susceptibility-weighted images in ultra-high-field magnetic resonance imaging. J Magn Reson Imaging. 2003;18:284–290. - PubMed
    1. Anderson LJ, Holden S, Davis B, Prescott E, Charrier CC, Bunce NH, Firmin DN, Wonke B, Porter J, Walker JM, Pennell DJ. Cardiovascular T2-star (T2*) magnetic resonance for the early diagnosis of myocardial iron overload. European Heart Journal. 2001;22:2171–2179. - PubMed
    1. Bartzokis G, Sultzer D, Mintz J, Holt LE, Marx P, Phelan CK, Marder SR. In vivo evaluation of brain iron in Alzheimer’s disease and normal subjects using MRI. Biol Psychiatry. 1994;35:480–487. - PubMed
    1. Bartzokis G, Tishler TA. MRI evaluation of basal ganglia ferritin iron and neurotoxicity in Alzheimer’s and Huntingon’s disease. Cell Mol Biol (Noisy-le-grand) 2000;46:821–833. - PubMed
    1. Bizzi A, Brooks RA, Brunetti A, Hill JM, Alger JR, Miletich RS, Francavilla TL, Di Chiro G. Role of iron and ferritin in MR imaging of the brain: a study in primates at different field strengths. Radiology. 1990;177:59–65. - PubMed

Publication types