

Baseline and longitudinal patterns of brain atrophy in MCI patients, and their use in prediction of short-term conversion to AD: results from ADNI
- PMID: 19027862
- PMCID: PMC2648825
- DOI: 10.1016/j.neuroimage.2008.10.031
Baseline and longitudinal patterns of brain atrophy in MCI patients, and their use in prediction of short-term conversion to AD: results from ADNI
Abstract
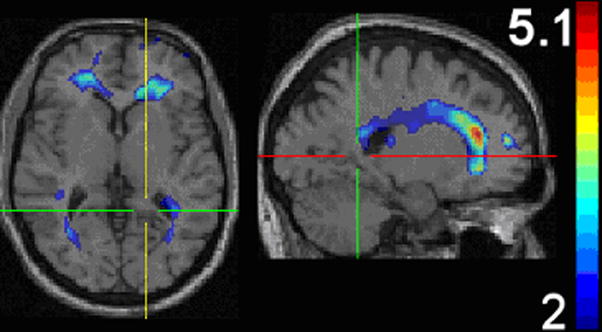
High-dimensional pattern classification was applied to baseline and multiple follow-up MRI scans of the Alzheimer's Disease Neuroimaging Initiative (ADNI) participants with mild cognitive impairment (MCI), in order to investigate the potential of predicting short-term conversion to Alzheimer's Disease (AD) on an individual basis. MCI participants that converted to AD (average follow-up 15 months) displayed significantly lower volumes in a number of grey matter (GM) regions, as well as in the white matter (WM). They also displayed more pronounced periventricular small-vessel pathology, as well as an increased rate of increase of such pathology. Individual person analysis was performed using a pattern classifier previously constructed from AD patients and cognitively normal (CN) individuals to yield an abnormality score that is positive for AD-like brains and negative otherwise. The abnormality scores measured from MCI non-converters (MCI-NC) followed a bimodal distribution, reflecting the heterogeneity of this group, whereas they were positive in almost all MCI converters (MCI-C), indicating extensive patterns of AD-like brain atrophy in almost all MCI-C. Both MCI subgroups had similar MMSE scores at baseline. A more specialized classifier constructed to differentiate converters from non-converters based on their baseline scans provided good classification accuracy reaching 81.5%, evaluated via cross-validation. These pattern classification schemes, which distill spatial patterns of atrophy to a single abnormality score, offer promise as biomarkers of AD and as predictors of subsequent clinical progression, on an individual patient basis.
Figures


References
-
- Karas GB, Scheltens P, Rombouts SARB, Visser PJ, Schijndel RAv, Fox NC, Barkhof F. Global and local gray matter loss in mild cognitive impairment and Alzheimer’s disease. Neuroimage. 2004;23:708–716. - PubMed
-
- Fox N, Schott J. Imaging cerebral atrophy: normal ageing to Alzheimer’s disease. Lancet. 2004;363:392–394. - PubMed
-
- Chetelat G, Desgranges B, de la Sayette V, Viader F, Eustache F, Baron JC. Mapping gray matter loss with voxel-based morphometry in mild cognitive impairment. Neuroreport. 2002;13:1939–1943. - PubMed
-
- Convit A, de Asis J, de Leon MJ, Tarshish CY, De Santi S, Rusinek H. Atrophy of the medial occipitotemporal, inferior, and middle temporal gyri in non-demented elderly predict decline to Alzheimer’s disease. Neurobiology of Aging. 2000;21:19–26. - PubMed
Publication types
MeSH terms
Grants and funding
LinkOut - more resources
Full Text Sources
Other Literature Sources
Medical
