Review
. 2009 Jan 15;325(2):317-28.
doi: 10.1016/j.ydbio.2008.10.043. Epub 2008 Nov 12.

Modeling the dynamics of transcriptional gene regulatory networks for animal development

Affiliations
Review

Modeling the dynamics of transcriptional gene regulatory networks for animal development

Smadar Ben-Tabou de-Leon et al. Dev Biol. .

Abstract

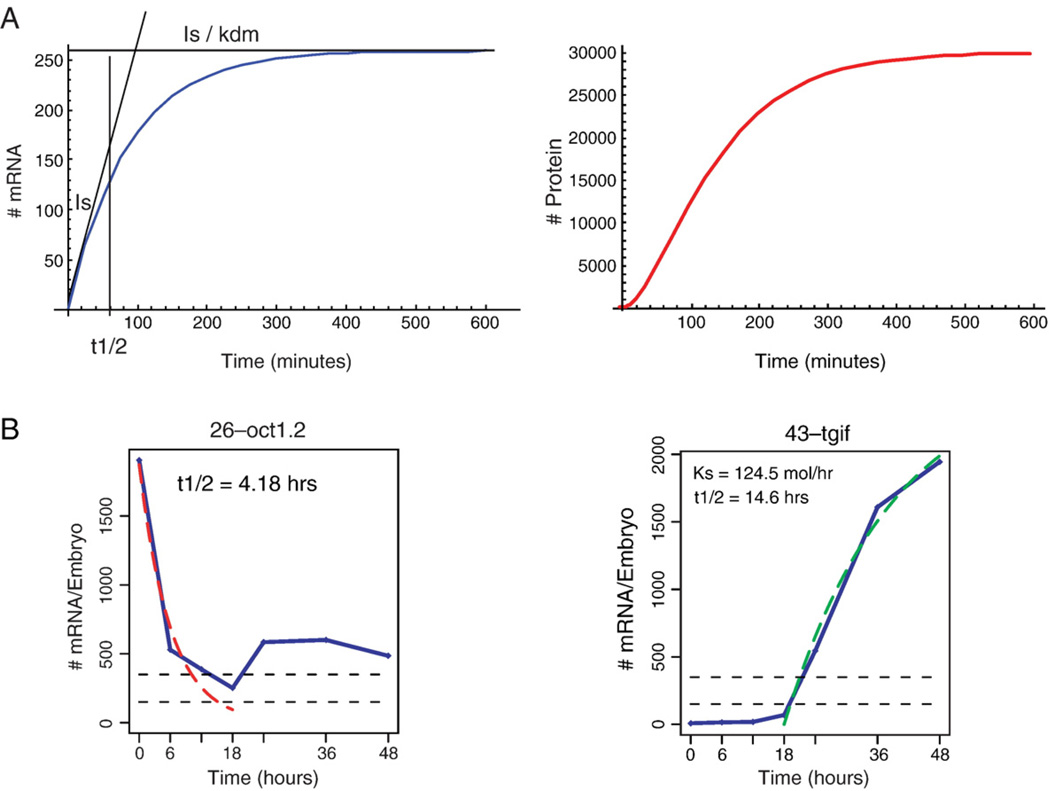
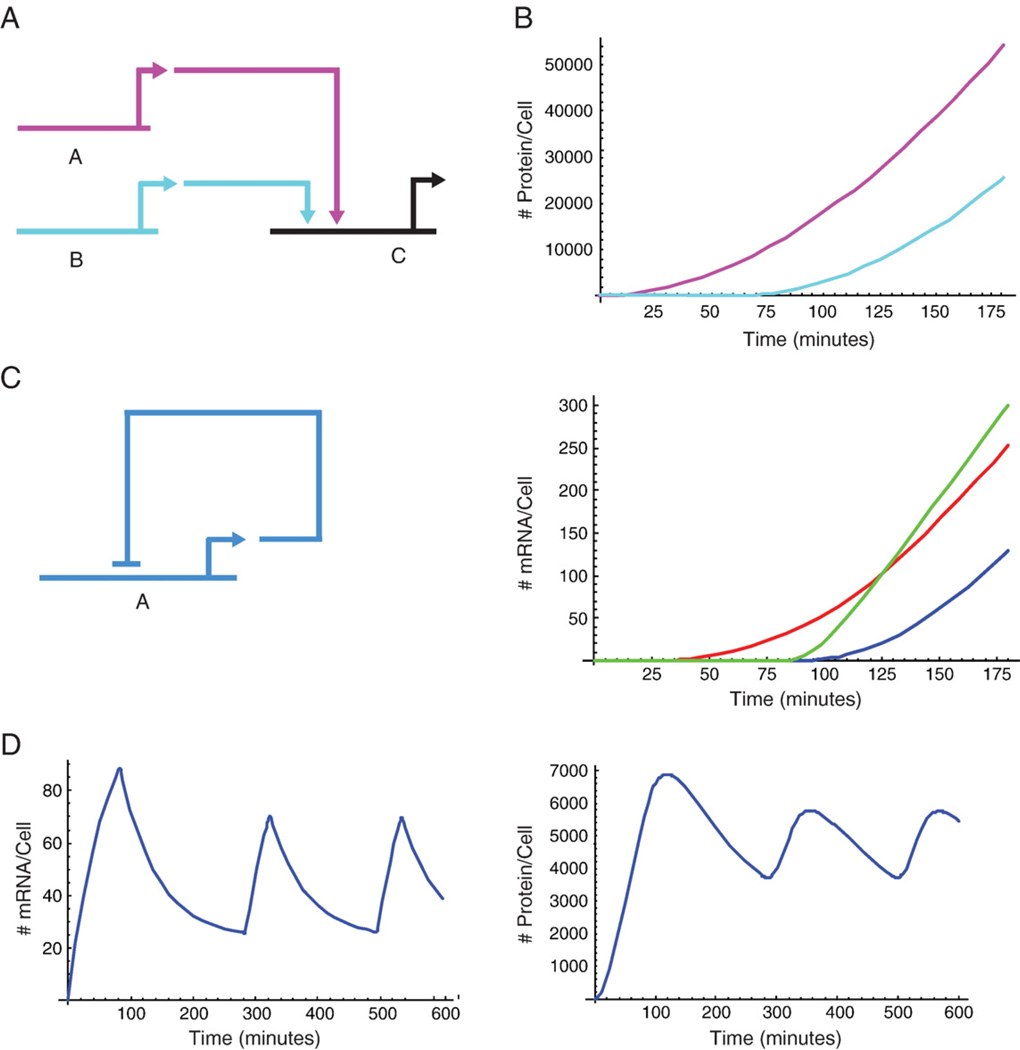
The dynamic process of cell fate specification is regulated by networks of regulatory genes. The architecture of the network defines the temporal order of specification events. To understand the dynamic control of the developmental process, the kinetics of mRNA and protein synthesis and the response of the cis-regulatory modules to transcription factor concentration must be considered. Here we review mathematical models for mRNA and protein synthesis kinetics which are based on experimental measurements of the rates of the relevant processes. The model comprises the response functions of cis-regulatory modules to their transcription factor inputs, by incorporating binding site occupancy and its dependence on biologically measurable quantities. We use this model to simulate gene expression, to distinguish between cis-regulatory execution of "AND" and "OR" logic functions, rationalize the oscillatory behavior of certain transcriptional auto-repressors and to show how linked subcircuits can be dealt with. Model simulations display the effects of mutation of binding sites, or perturbation of upstream gene expression. The model is a generally useful tool for understanding gene regulation and the dynamics of cell fate specification.


Figures

Fig. 1
Fig. 1
Processes involved in transcription and translation. (A) For mRNA synthesis these are transcription initiation, RNA polymerase translocation, mRNA processing and mRNA export from the nucleus to the cytoplasm. The level of mRNA depends also on mRNA turnover rate. The processes that control protein level are translation and protein turnover rates. (B) The initiation rate controls the number of transcripts that are generated within a given time interval. The higher is the initiation rate the more mRNA copies are produced.
Fig. 2
Fig. 2
mRNA and protein accumulation functions. (A) The mRNA and protein accumulation curves were obtained by substituting the following kinetic parameters in eqs. (1) and (2): Is=3 initiations/minute, kt=2 protein/(mRNA×minute), kdm=Ln2/60=0.012 min−1, and kdp=Ln2/40=0.014 min−1. The initiation rate, Is, is the initial linear slope of the mRNA accumulation curve. The maximal level of mRNA is the steady state level, Is/kdm. The half-life, t1/2=ln2/kdm, is the time when the mRNA accumulation function reaches half maximum. The simulation was done using Mathematica 5.2. (B) Use of the model to fit experimental measurements of mRNA levels in sea urchin embryos (Howard-Ashby et al., 2006). Left, for maternal transcripts, i.e., genes that their mRNA is present in the egg, the initiation rate is zero at early times and the mRNA level decays exponentially as e−kdmt, Eq. (1). A fit to the measured mRNA time course for the maternal phase of the gene oct1.2, results in half-lifetime of 4.18 h. (oct1.2 has a zygotic phase, i.e., transcription that starts after fertilization, initiated at 18 hpf, that was not fitted with the model). Right, Eq. (3) was used to fit the mRNA accumulation curve for the zygotic gene, tgif. The zygotic expression of this gene starts at about 18 hpf, so 18 hpf is the t=0 in this simulation. The result is an initiation rate of 124 molecules/hour and half-life of 14.6 h. Reprinted from Howard-Ashby et al., 2006. Dev. Biol. 300, 74–89; copyright Elsevier, Inc.
Fig. 3
Fig. 3
Occupancy and transcription. (A) The occupancy of a binding site depends on the ratio of its association and dissociation rate constants, kaS and kdS, respectively, and on the transcription factor concentration. (B) Initiation rate dependence on occupancy for different activation strengths, kb (Eq. (12)). Red curve, kb=5, green curve, kb=20 and blue curve kb=50. At low occupancy the initiation rate increases linearly with the occupancy with a slope of kb. In this example we consider Imax=11 initiations per minute, as calculated in text for 2 gene copies at 15 °C. The simulation was done using Mathematica 5.2. (C) Cooperative binding to the DNA increases the stability of the factor–DNA complex. The cooperativity constant, Kq, indicates how much the two factor–DNA complex is stabilized compared to independent binding of the two factors. Free energy contributions for DNA–protein and protein–protein interactions are indicated by green and yellow arrows respectively.
Fig. 4
Fig. 4
Simple GRN subcircuits and kinetic outputs. (A) Subcircuit in which regulatory genes a and b produce factors that activate the expression of gene c. (B) Time courses for expression of a, b and c, assuming different logic gates. Upper panel: Time courses for protein output of a (magenta) and b (cyan). b is activated 60 min after the activation of a and both factors are activated at constant initiation rate of Is=2. Bottom panel: Time course for c mRNA under different cis-regulatory gates processing inputs from a and b genes. Red curve: c is regulated by a Additive OR b inputs, Eq. (14). Blue curve: c is regulated by a AND b inputs, Eq. (16), Kq=1. Green curve: c is regulated by a AND b inputs and the binding of a and b is cooperative, Eq. (16), Kq=20. The parameters used in this simulation are: Relative equilibrium constant, Kr=105, activation strength, kb=5, mRNA turnover rate kdm=0.001 min−1, protein turnover kdp=0.002 min−1, translation rate, kt=2 protein/(mRNA×minute), mRNA transcription delay, Tm=20 min. The number of non-specific sites, Dn, was estimated as 90% of the total sea urchin genome, which is 8×10⁸, so Dn=7.2×10⁸. The initial levels of all genes, a, b and c was assumed to be zero at time zero. (C) Auto-repression sub-circuit. (D) Time courses of mRNA (left) and protein (right) for an auto-repressor operating according to the threshold model (Eq. 18). The kinetic parameters used in this simulation are: kt=2, Is=2, Kr=105, kdm=kdp=0.017 min−1, Y0=0.36, B0=0.2, Dn=7.2×10⁸ and Tm=20 min. Simulations were done using Mathematica 5.2.
Fig. 5
Fig. 5
Compound GRN circuit. (A) Schematic diagram of the circuit. Gene A activates gene B. Gene B has a positive feedback into its own cis-regulatory module. Gene B activates gene C, and genes B and C together activate gene D. The cis-regulatory module of B executes Additive OR logic on A and B, and the cis-regulatory module of D executes AND logic on B and C. (B) Time courses of the mRNA expression levels of genes A (magenta), B (cyan), C (dark blue) and D (green). (C) Time course of the protein expression levels of genes A, B, C and D, color code similar to (B). The parameters used in this simulation are: Relative equilibrium constant, Kr=105, activation strength for all the equations, kb=2, mRNA turnover rates: kdmA=0.001 min−1, kdmB=kdmC=kdmD= 0.005 min−1, protein turnover rates: kdp=0.01 min−1, kdpB=kdpC=kdpD=0.008 min−1, translation rate, kt=2 protein/(mRNA×minute), mRNA transcription delay, Tm=40 min, cooperativity factor Kq=1. The number of non-specific sites, Dn, was estimated as 90% of the total sea urchin genome, which is 8×10⁸, so Dn=7.2×10⁸. The initial levels of the protein A, and the mRNA and protein of B, C and D were assumed to be zero at time zero. The initial mRNA level of gene A, mA(0)=500 molecules per cell. Simulations were done using Mathematica 5.2.

References

    1. Ackers GK, Johnson AD, Shea MA. Quantitative model for gene regulation by lambda phage repressor. Proc. Natl. Acad. Sci. U.S.A. 1982;79:1129–1133. - PMC - PubMed
    1. Amore G, Davidson EH. cis-Regulatory control of cyclophilin, a member of the ETS-DRI skeletogenic gene battery in the sea urchin embryo. Dev. Biol. 2006;293:555–564. - PubMed
    1. Arnosti DN, Barolo S, Levine M, Small S. The eve stripe 2 enhancer employs multiple modes of transcriptional synergy. Development. 1996;122:205–214. - PubMed
    1. Aronson AI, Chen K. Rates of RNA chain growth in developing sea urchin embryos. Dev. Biol. 1977;59:39–48. - PubMed
    1. Barolo S, Levine M. hairy mediates dominant repression in the Drosophila embryo. EMBO J. 1997;16:2883–2891. - PMC - PubMed

Publication types

LinkOut - more resources