. 2009 Mar 1;45(1):160-8.
doi: 10.1016/j.neuroimage.2008.10.034. Epub 2008 Nov 6.

Modulation of spontaneous fMRI activity in human visual cortex by behavioral state

Affiliations

Modulation of spontaneous fMRI activity in human visual cortex by behavioral state

Marta Bianciardi et al. Neuroimage. .

Abstract

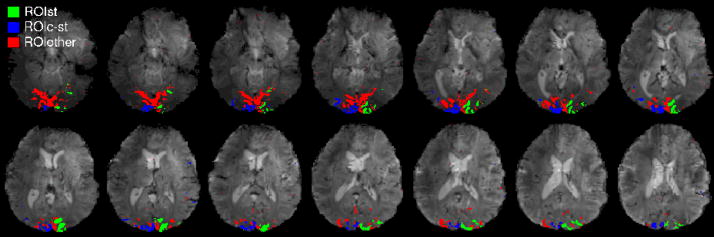
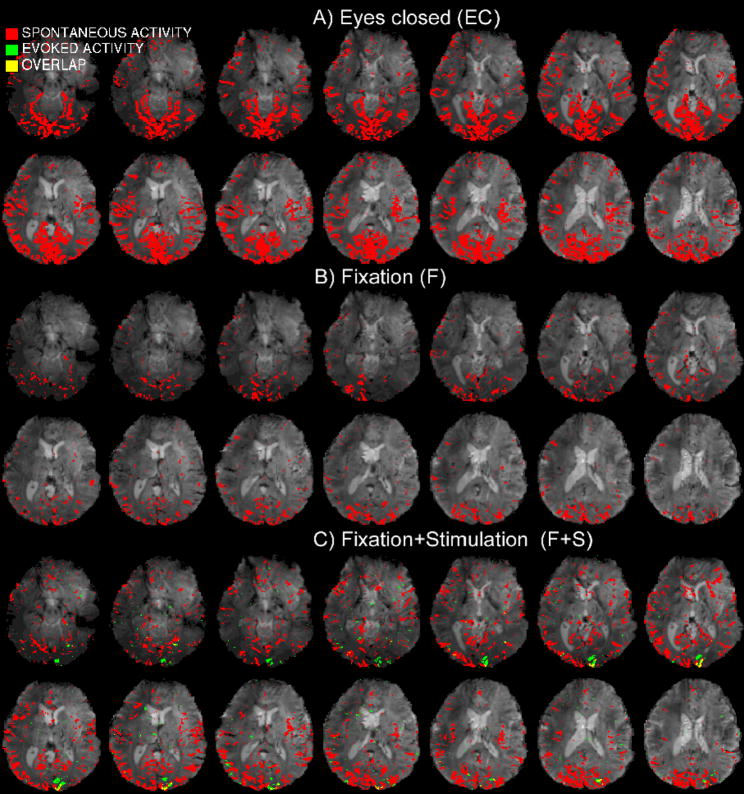
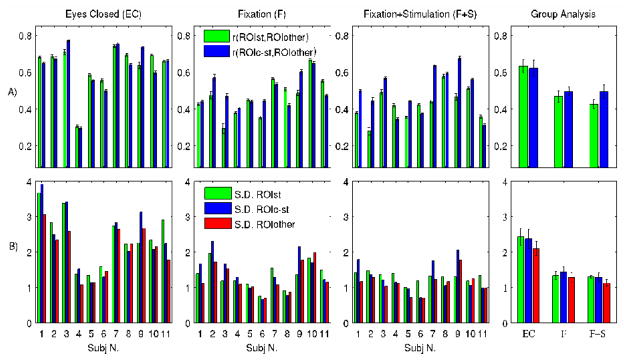
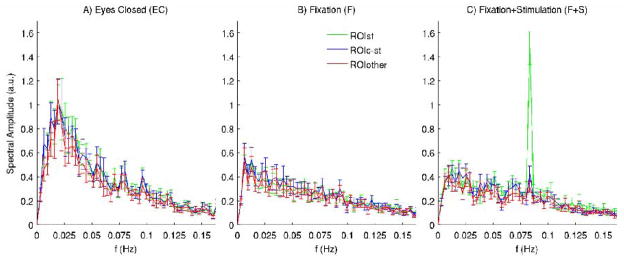
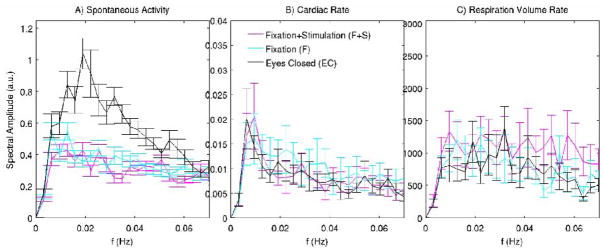
The phenomenon of spontaneous fMRI activity is increasingly being exploited to investigate the connectivity of functional networks in human brain with high spatial-resolution. Although mounting evidence points towards a neuronal contribution to this activity, its functional role and dependence on behavioral state remain unclear. In this work, we used BOLD fMRI at 7 T to study the modulation of spontaneous activity in occipital areas by various behavioral conditions, including resting with eyes closed, eyes open with visual fixation, and eyes open with fixation and focal visual stimulation. Spontaneous activity was separated from evoked activity and from signal fluctuations related to cardiac and respiratory cycles. We found that spontaneous activity in visual areas was substantially reduced (amplitude (44%) and coherence (25%)) with the fixation conditions relative to the eyes-closed condition. No significant further modulation was observed when the visual stimulus was added. The observed dependence on behavioral condition suggests that part of spontaneous fMRI signal fluctuations represents neuronal activity. Possible mechanisms for the modulation of spontaneous activity by behavioral state are discussed. The observed linear superposition of spontaneous fMRI activity with focal evoked activity related to visual processing has important implications for fMRI studies, which ideally should take into account the effect of spontaneous activity to properly define brain activations during task conditions.


Figures

Figure 1
Figure 1. Employed stimulus and stimulation design
The stimulus employed in the experiment is shown. It consists of a B/W wedge-shaped checkerboard contrast reversing at 7.5Hz. The wedge was used during: 1) fixation to a central dot concurrent with visual stimulation at 0.083Hz (block design with 6sON/6s OFF cycle, condition F+S); 2) in the functional localizer polar-angle mapping run, with the wedge performing a full clockwise rotation every 90s. During condition F+S, the stimulation frequency was carefully chosen so as to minimize the overlap in the spectral domain with spontaneous activity in the visual cortex (< 0.05Hz). The polar-angle mapping run was employed to define three regions of interest within the visual cortex (see Figure 2). Wedge positions LL (“lower left”) and LR (“lower right”) are at polar-angle equal to 228° and 132°, respectively (0° is at the upper vertical meridian).
Figure 2
Figure 2. Characterization of functional regions of interest in the visual cortex
By a functional localizer polar-angle mapping run (~8.5 min), employing a rotating wedge-shaped checkerboard (Figure 1), we defined (p < 0.0001, uncorrected for multiple comparisons) three functional regions of interest (ROIs): a stimulated region, ROIST (green), which comprises cortical areas responding to the wedge in position LL (Figure 1); a region contralateral to ROIST, ROIC-ST (blue), which responds to the same wedge, but in position LR (Figure 1); a region in the visual cortex responding to the rotating wedge in any position (excluding ROIST and ROIC-ST), ROIOTHER (red). ROIST and ROIC-ST correspond, respectively, to the stimulated area and to a task-unrelated area during the stimulation condition F+S; ROIOTHER comprises neighboring visual areas, and was used to extract the internal reference time-series for spontaneous fluctuations, used to define the spatial extent of spontaneous activity and its coherence. The three ROIs are displayed for a single subject (see Supplementary Material, Figure 1SM, for ROIs of another example data-set).
Figure 3
Figure 3. Activation maps of spontaneous and evoked signals
Spontaneous activity patterns (red, p < 0.005 Bonferroni corrected, and same slices as in Figure 2), are displayed for the three investigated conditions (EC, F, and F+S) for an example data-set (results for another subject are shown in Supplementary Material, Figure 2SM). In general, correlation analysis of spontaneous signals with the internal reference time-series was performed after data low-pass filtering at 0.073Hz, which removed high frequency noise, as well as stimulus-related signals during condition F+S. Maps of spontaneous activity, evoked activity (green p < 0.0001) and their overlap (yellow) are displayed during condition F+S for the same subject.
Figure 4
Figure 4. Coherence and amplitude of spontaneous activity in the visual cortex
For the investigated conditions (F+S, F, EC) we show: A) the inter-regional coherence of spontaneous activity within the visual cortex at both the single subject (first three panels from the left, average ± s.e. across voxels,) and the group level (fourth panel, average ± s.e. across subjects, n = 11); for example r(ROIST, ROIOTHER) indicates the correlation strength of spontaneous signals in the stimulated region with the reference average signal extracted from neighboring visual areas; B) the amplitude of spontaneous fluctuations in three ROIs of the visual cortex (Figure 2). Their amplitude was measured in terms of the standard deviation of average signals within each of the three ROIs. Spontaneous activity persisted during visual stimulation and was significantly reduced in terms of both coherence and amplitude during the fixation conditions with respect to the eyes closed condition.
Figure 5
Figure 5. Characterization of spontaneous and evoked activity in the spectral domain
For the three employed conditions A)-C), the spectral amplitude of average signals in three ROIs of the visual cortex (see Figure 2) are displayed. Error bars indicate mean ± s.e. across subjects (n = 11). Note the similarity of spontaneous fluctuations (predominant at lower frequencies) in different regions of the visual cortex and, for the F+S condition, the superposition of evoked responses at the stimulation frequency (0.083Hz) on spontaneous fluctuations in the stimulated area (ROIST) only. Moreover, spontaneous signal fluctuations are stronger during the eyes closed condition with enhanced signal amplitudes mostly below 0.05Hz, with a peak at about 0.02Hz.
Figure 6
Figure 6. Characterization of spontaneous activity in the visual cortex and of possible confounds
We display the spectral amplitude of group average spontaneous fluctuations (n = 11) in the visual cortex (A) and of confounding effects, i.e. cardiac (B) and respiration volume (C) rate (n = 9), during the three employed conditions (EC, F, F+S). Low-pass filtering at 0.073Hz was applied to spontaneous signals before averaging within the three defined ROIs in the visual cortex (Figure 2); for display purposes, the error bars in A) are across 33 repetitions (11 subject × 3 ROIs) per condition. The amplitudes of spontaneous BOLD signals in the frequency range 0.0127–0.054 Hz are reduced during the fixation conditions. This amplitude modulation is not associated to any systematic change in respiration and heartbeat rate across conditions at any frequency (range 0–0.16 Hz).

References

    1. Arieli A, Sterkin A, Grinvald A, Aertsen A. Dynamics of ongoing activity: explanation of the large variability in evoked cortical responses. Science. 1996;273:1868–1871. - PubMed
    1. Barry RJ, Clarke AR, Johnstone SJ, Magee CA, Rushby JA. EEG differences between eyes-closed and eyes-open resting conditions. Clin Neurophysiol. 2007;118:2765–2773. - PubMed
    1. Berger H. Über das Elektroenkephalogramm des Menschen. Berlin: Archiv für Psychiatrie und Nervenkrankheiten. 1929;87:527–570.
    1. Bianciardi M, Fukunaga M, van Gelderen P, Horovitz SG, de Zwart J, Duyn J. Spontaneous activity in the visual cortex persists during visual stimulation: a 7 T study; Proceedings of the 16th ISMRM Scientific Meeting; Toronto, Canada. 2008. p. 146. Book of Abstracts N. 747.
    1. Birn RM, Diamond JB, Smith MA, Bandettini PA. Separating respiratory-variation-related fluctuations from neuronal-activity-related fluctuations in fMRI. Neuroimage. 2006;31:1536–1548. - PubMed

Publication types