. 2009 May;91(4):382-92.
doi: 10.1016/j.nlm.2008.10.010. Epub 2008 Dec 16.

The basolateral amygdala modulates specific sensory memory representations in the cerebral cortex

Affiliations

The basolateral amygdala modulates specific sensory memory representations in the cerebral cortex

Candice M Chavez et al. Neurobiol Learn Mem. 2009 May.

Abstract

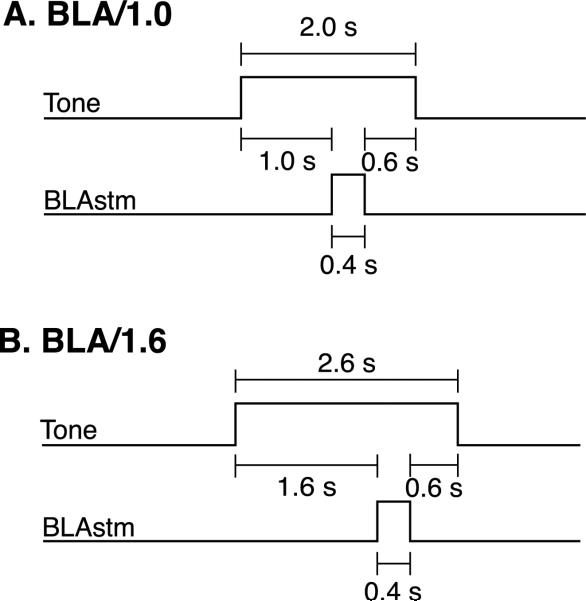
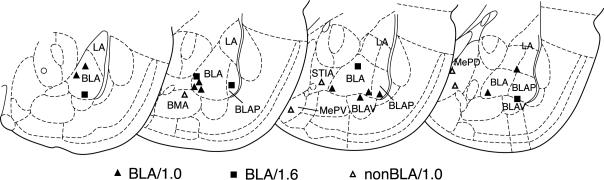
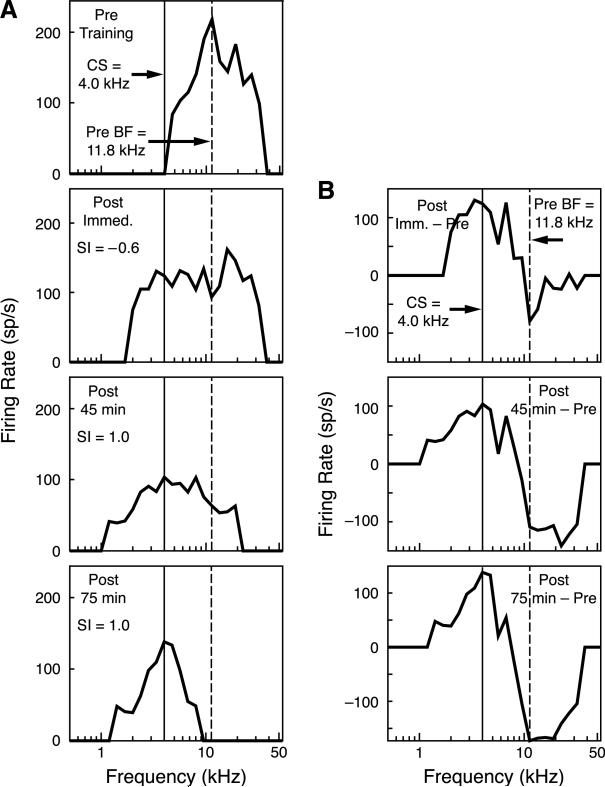
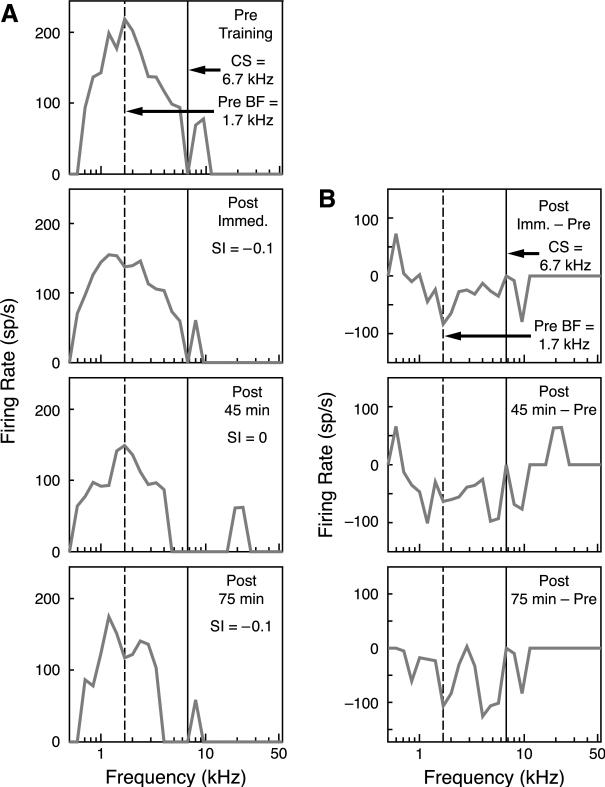
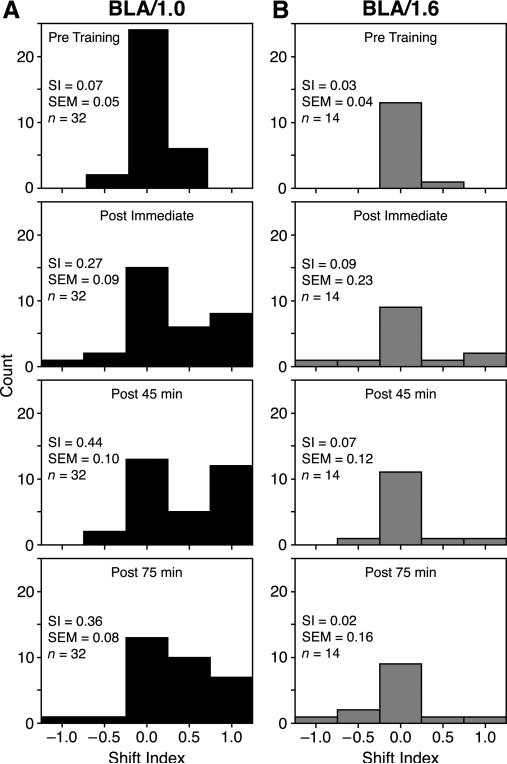
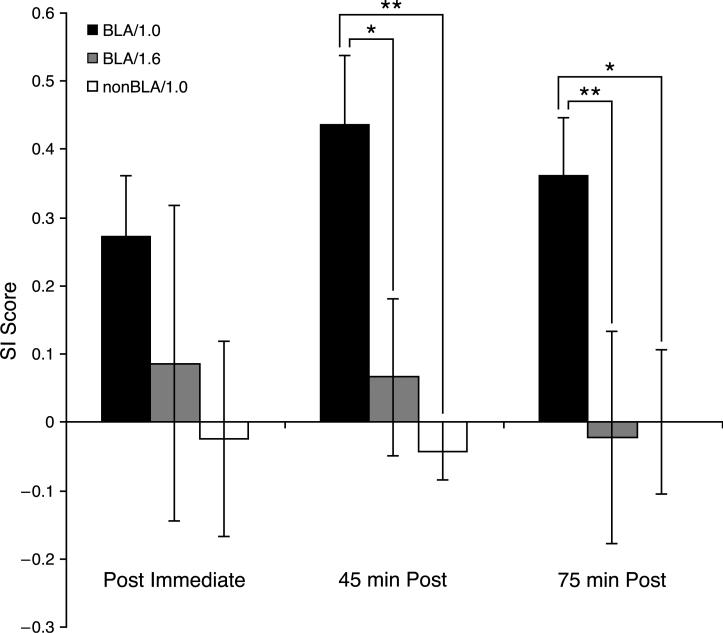
Stress hormones released by an experience can modulate memory strength via the basolateral amygdala, which in turn acts on sites of memory storage such as the cerebral cortex [McGaugh, J. L. (2004). The amygdala modulates the consolidation of memories of emotionally arousing experiences. Annual Review of Neuroscience, 27, 1-28]. Stimuli that acquire behavioral importance gain increased representation in the cortex. For example, learning shifts the tuning of neurons in the primary auditory cortex (A1) to the frequency of a conditioned stimulus (CS), and the greater the level of CS importance, the larger the area of representational gain [Weinberger, N. M. (2007). Associative representational plasticity in the auditory cortex: A synthesis of two disciplines. Learning & Memory, 14(1-2), 1-16]. The two lines of research suggest that BLA strengthening of memory might be accomplished in part by increasing the representation of an environmental stimulus. The present study investigated whether stimulation of the BLA can affect cortical memory representations. In male Sprague-Dawley rats studied under urethane general anesthesia, frequency receptive fields were obtained from A1 before and up to 75min after the pairing of a tone with BLA stimulation (BLAstm: 100 trials, 400ms, 100Hz, 400microA [+/-16.54]). Tone started before and continued after BLAstm. Group BLA/1.0 (n=16) had a 1s CS-BLAstm interval while Group BLA/1.6 (n=5) has a 1.6s interval. The BLA/1.0 group did develop specific tuning shifts toward and to the CS, which could change frequency tuning by as much as two octaves. Moreover, its shifts increased over time and were enduring, lasting 75min. However, group BLA/1.6 did not develop tuning shifts, indicating that precise CS-BLAstm timing is important in the anesthetized animal. Further, training in the BLA/1.0 paradigm but stimulating outside of the BLA did not produce tuning shifts. These findings demonstrate that the BLA is capable of exerting highly specific, enduring, learning-related modifications of stimulus representation in the cerebral cortex. These findings suggest that the ability of the BLA to alter specific cortical representations may underlie, at least in part, the modulatory influence of BLA activity on strengthening long-term memory.


Figures

Fig. 1
Fig. 1
(A) BLA/1.0 training protocol consisted of at 2.0 s tone paired with 0.40 s BLA stimulation train. The tone–BLA stimulation interval was 1.0 s. The tone then continued for 0.60 s after BLA stimulation. (B) BLA/1.6 training protocol consisted of a 2.6 s tone paired with a 0.40 s BLA stimulation train. The tone–BLA stimulation interval was 1.6 s, the tone then continued for 0.60 s after BLA stimulation.
Fig. 2
Fig. 2
An example of a frequency response area (FRA) obtained before training. The BFmax is defined as the frequency–intensity (dB level) that elicited the greatest neuronal discharge. In this illustration, the BFmax was 26.9 kHz at 70 dB SPL. The BFmax was used for all analyses.
Fig. 3
Fig. 3
Electrode placements for each animal for each group. BLA/1.0, n = 11; BLA/1.6, n = 5; nonBLA/1.0, n = 5. Basal lateral amygdala (BLA); posterior basal lateral amygdala (BLAP); ventral basal lateral amygdala (BLAV); lateral amygdala (LA); basomedial amygdala (BMA); postereodorsal medial amygdala (MEPD); postereoventral medial amygdala (MEPV); bed nucleus of the stria terminalis (STIA).
Fig. 4
Fig. 4
(A) Example of tuning curves recorded from an animal in the BLA/1.0 group. Top row is the pre-training tuning curve with a BFmax that was at 11.3 kHz; the training frequency (CS) selected was 4.0 kHz. Immediately after training, there was a large decrease in responsiveness at the BFmax and an increase in responsiveness at the CS frequency. Tuning shifted to the CS frequency at 45 min (SI = 1.0) and the receptive field became even more sharply tuned at 75 min, while maintaining its peak at the CS frequency (SI = 1.0). (B) Differences between the pre- and post-training tuning curves. Immediately after training, there was a maximum decrease in responsiveness to the BFmax and a maximum increase in response to the CS frequency. This pattern continued and grew 45 min after training and increased even more at the 75-min time period.
Fig. 5
Fig. 5
(A) Examples of tuning curves recorded from an animal in the BLA/1.6 group. Tuning Training shifts were negligible in this group. The top row is the pre-training tuning curve with a BFmax at 1.7 kHz; the chosen was 6.7 kHz. Immediately after training, there was a slight decrease in firing rate at the BFmax and a slight shift in the BFmax frequency away from the training frequency. At 45 min after training, the BFmax frequency returned to the pre-training BFmax (1.7 kHz) and the firing rate did not change. At 75 min after training, the there was a slight shift away from the training frequency again and the firing rate did not change. (B) Differences between the pre- and post-training tuning curves. At each time period, there was no clear shift in tuning away from or towards the training frequency.
Fig. 6
Fig. 6
The distribution of SI scores across the pre-training and post-training periods. (A) BLA/1.0 tuning. Note the increase in positive SI scores indicating tuning shifts toward the CS frequency. (B) BLA/1.6 tuning. Note the lack of CS-directed tuning shifts for any post-training time period. Bin-width of distributions = 0.5 SI; zero bin range = –0.25 to 0.25 SI.
Fig. 7
Fig. 7
SI scores (±SE) for all three groups, across time. The BLA/1.0 group had a significantly larger SI score than the BLA/1.6 and the nonBLA/1.0 groups at 45 and 75 min after training. *p < .05; **p < .01.

References

    1. Bakin JS, Lepan B, Weinberger NM. Sensitization induced receptive field plasticity in the auditory cortex is independent of CS-modality. Brain Research. 1992;577(2):226–235. - PubMed
    1. Bakin JS, Weinberger NM. Classical conditioning induces CS-specific receptive field plasticity in the auditory cortex of the guinea pig. Brain Research. 1990;536(1–2):271–286. - PubMed
    1. Bakin JS, Weinberger NM. Induction of a physiological memory in the cerebral cortex by stimulation of the nucleus basalis. Proceedings of the National Academy of Sciences of the United States of America. 1996;93(20):11219–11224. - PMC - PubMed
    1. Bao S, Chan VT, Merzenich MM. Cortical remodelling induced by activity of ventral tegmental dopamine neurons. Nature. 2001;412(6842):79–83. - PubMed
    1. Bergado JA, Rojas Y, Capdevila V, González O, Almaguer-Melian W. Stimulation of the basolateral amygdala improves the acquisition of a motor skill. Restorative Neurology and Neuroscience. 2006;24(2):115–121. - PubMed

Publication types