

Imaging of the retinal nerve fibre layer for glaucoma
- PMID: 19028735
- PMCID: PMC2907255
- DOI: 10.1136/bjo.2008.145540
Imaging of the retinal nerve fibre layer for glaucoma
Abstract
Background: Glaucoma is a group of diseases characterised by retinal ganglion cell dysfunction and death. Detection of glaucoma and its progression are based on identification of abnormalities or changes in the optic nerve head (ONH) or the retinal nerve fibre layer (RNFL), either functional or structural. This review will focus on the identification of structural abnormalities in the RNFL associated with glaucoma.
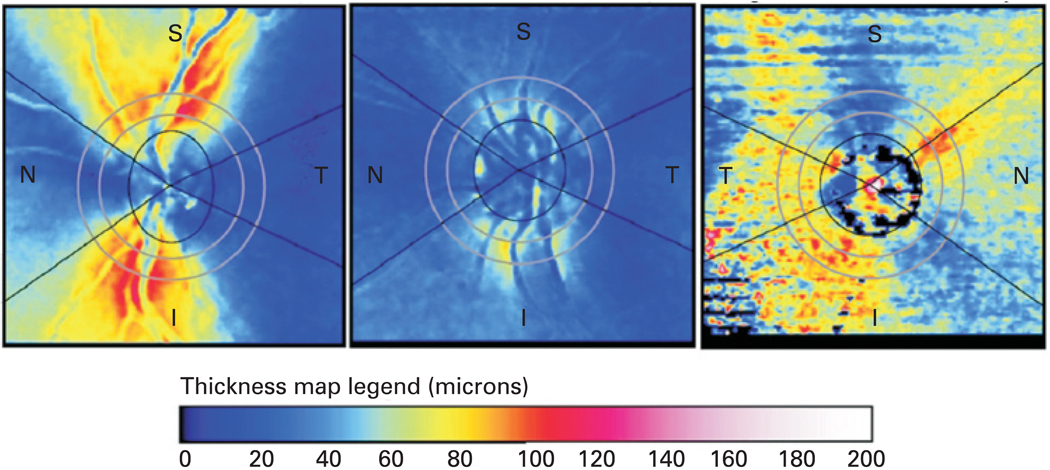
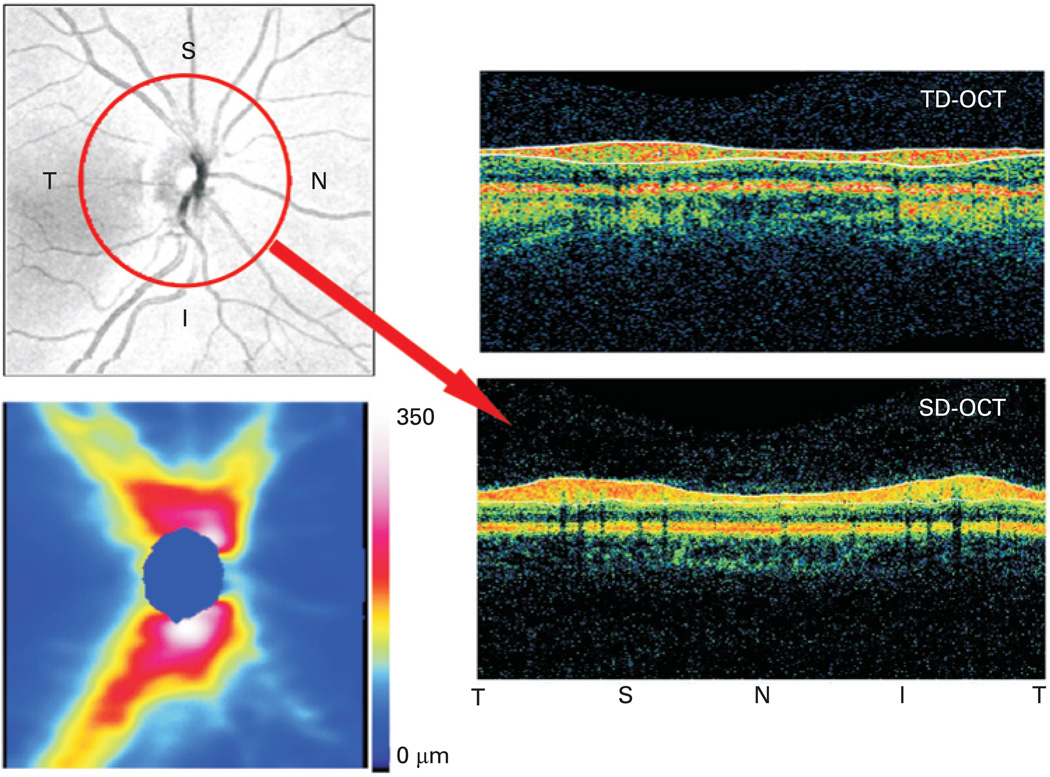
Discussion: A variety of new techniques have been created and developed to move beyond photography, which generally requires subjective interpretation, to quantitative retinal imaging to measure RNFL loss. Scanning laser polarimetry uses polarised light to measure the RNFL birefringence to estimate tissue thickness. Optical coherence tomography (OCT) uses low-coherence light to create high-resolution tomographic images of the retina from backscattered light in order to measure the tissue thickness of the retinal layers and intraretinal structures. Segmentation algorithms are used to measure the thickness of the retinal nerve fibre layer directly from the OCT images. In addition to these clinically available technologies, new techniques are in the research stages. Polarisation-sensitive OCT has been developed that combines the strengths of scanning laser polarimetry with those of OCT. Ultra-fast techniques for OCT have been created for research devices. The continued utilisation of imaging devices into the clinic is refining glaucoma assessment. In the past 20 years glaucoma has gone from a disease diagnosed and followed using highly subjective techniques to one measured quantitatively and increasingly objectively.
Conflict of interest statement
Figures
References
-
- Weinreb RN, Shakiba S, Zangwill L. Scanning laser polarimetry to measure the nerve fibre layer of normal and glaucomatous eyes. Am J Ophthalmol. 1995;119:627–636. - PubMed
-
- Weinreb RN, Dreher AW, Coleman A, et al. Histopathologic validation of Fourier-ellipsometry measurements of retinal nerve fiber layer thickness. Arch Ophthalmol. 1990;108:557–560. - PubMed
-
- Tuulonen A, Airaksinen PJ. Polarimetry of the retinal nerve fiber layer. Curr Opin Ophthalmol. 1996;7:34–38. - PubMed
-
- Junghardt A, Schmid MK, Schipper I, et al. Reproducibility of the data determined by scanning laser polarimetry. Graefes Arch Clin Exp Ophthalmol. 1996;234:628–632. - PubMed
Publication types
MeSH terms
Grants and funding
LinkOut - more resources
Full Text Sources
Medical
Miscellaneous