. 2009 Aug;19(8):1723-37.
doi: 10.1093/cercor/bhn194. Epub 2008 Nov 21.

Synaptogenesis in purified cortical subplate neurons

Affiliations

Synaptogenesis in purified cortical subplate neurons

Claire E McKellar et al. Cereb Cortex. 2009 Aug.

Abstract

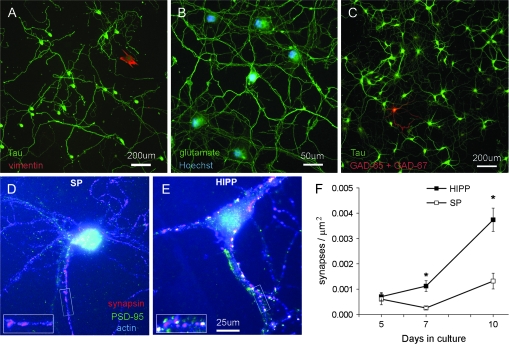
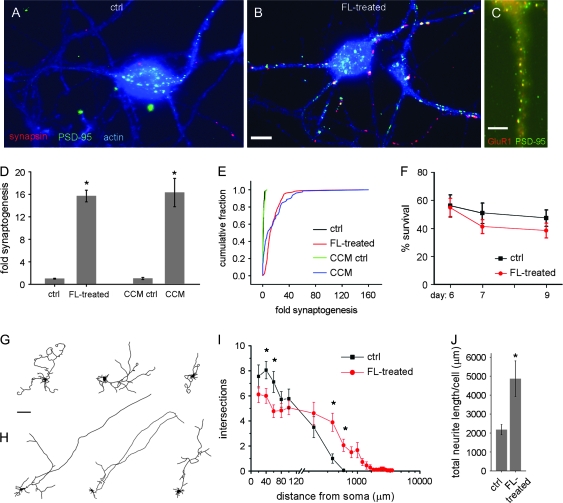
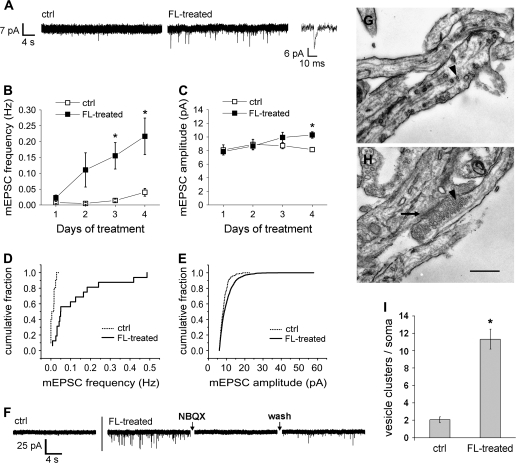
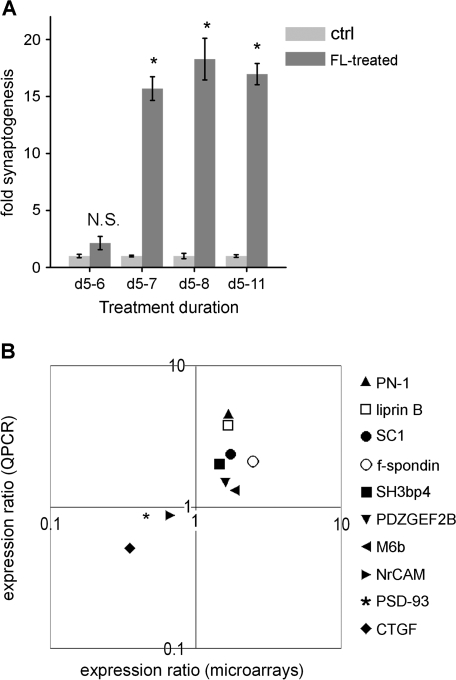
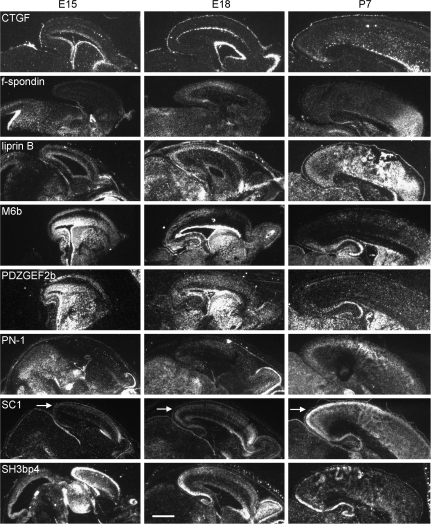
An ideal preparation for investigating events during synaptogenesis would be one in which synapses are sparse, but can be induced at will using a rapid, exogenous trigger. We describe a culture system of immunopurified subplate neurons in which synaptogenesis can be triggered, providing the first homogeneous culture of neocortical neurons for the investigation of synapse development. Synapses in immunopurified rat subplate neurons are sparse, and can be induced by a 48-h exposure to feeder layers of neurons and glia, an induction more rapid than any previously reported. Induced synapses are electrophysiologically functional and ultrastructurally normal. Microarray and real-time PCR experiments reveal a new program of gene expression accompanying synaptogenesis. Surprisingly few known synaptic genes are upregulated during the first 24 h of synaptogenesis; Gene Ontology annotation reveals a preferential upregulation of synaptic genes only at a later time. In situ hybridization confirms that some of the genes regulated in cultures are also expressed in the developing cortex. This culture system provides both a means of studying synapse formation in a homogeneous population of cortical neurons, and better synchronization of synaptogenesis, permitting the investigation of neuron-wide events following the triggering of synapse formation.


Figures

Figure 1.
Figure 1.
Subplate neuron cultures contain highly purified, glutamatergic neurons but few synapses. (A) Subplate cultures immunostained at 7 d.i.v. for Tau (pseudocolored green) to label neurons and vimentin (red) to label nonneuronal cells. (B) Subplate cultures immunostained for glutamate (green) with a Hoescht counterstain for nuclei (blue). (C) Immunofluorescence for GAD-65 and GAD-67 (combined in red) to label GABAergic neurons, with all neurons counterstained for Tau (green). (D) Subplate or (E) hippocampal neurons cultured for 10 days then immunostained for synapsin (red) and PSD-95 (green); counterstained using phalloidin to detect actin (blue). Synapses are defined as puncta colocalizing synapsin and PSD-95 (arrowheads), which appear yellow (or white in the presence of the blue phalloidin counterstain). Inset: magnified view of a portion of dendrite from each image. (F) Quantification of colocalized puncta per square micron of phalloidin-labeled neurite in subplate versus hippocampal neurons at indicated times in culture. Mean ± SEM, compiled from 3 experiments. Asterisks = P < 0.05, Student's t-test.
Figure 2.
Figure 2.
Synaptogenesis can be induced by a cortical feeder layer. (A, B) Subplate neurons on coverslips, cultured for 5 days then placed on spacers above either an empty well (“ctrl”) or a well containing a feeder layer (FL) of cortical neurons and glia (“FL-treated”) for 2 days. Subplate coverslips are immunostained for synapsin (pseudocolored red) and PSD-95 (green), counterstained with phalloidin for actin (blue) (synapses: yellow or white puncta). Scale bar = 10 μm. (C) Feeder layer-treated subplate neurons immunostained for PSD-95 (green) and GluR1 (red). Scale bar = 5 μm. (D) Fold synaptogenesis = number of colocalized synapsin and PSD-95 puncta per μm2 of neurite (actin-stained) for subplate neurons grown from 5 to 7 d.i.v. in wells above cortical feeder layers (FL-treated) or using medium removed from the feeder layers (CCM), normalized to respective controls. Mean ± SEM, compiled from 9 or 4 experiments, respectively. P < 0.001, Student's t-test. (E) Cumulative fraction plot showing full distribution of normalized data for fold synaptogenesis, compiled from 64 to 208 separate images per condition. Kolmogorov–Smirnov P < 0.001 between each treatment and its control. (F) Percent survival of subplate neurons grown in control wells or above cortical feeder layers from 5 d.i.v. until indicated ages. Mean ± SEM, compiled from 10 experiments. (G, H) Example tracings of EGFP-filled cells in control (G) and feeder layer-treated (H) subplate neurons. Scale bar = 100 μm. (I) Sholl analysis of control and feeder layer-treated subplate neurons, demonstrating number of processes crossing rings drawn at the indicated distances from soma. Scale is logarithmic following break. N = 18 cells from 3 preps, in each condition. Asterisks = P < 0.05, Student's t-test. (J) Total length of all neurites/cell in control and feeder layer-treated subplate neurons. Asterisks = P < 0.05, Student's t-test.
Figure 3.
Figure 3.
Feeder layer exposure induces functional synapses that are ultrastructurally normal. (A) Whole-cell patch clamp recordings from subplate neurons grown in control wells (ctrl) or above cortical feeder layers from 5 to 8 d.i.v. (FL-treated). Downward deflections represent mEPSCs. Magnified event shows characteristic mEPSC shape. (B) Frequency and (C) amplitude of mEPSCs in subplate neurons in control wells or above feeder layers for the durations shown, beginning at 5 d.i.v. (In both control and, less frequently, FL-treated conditions, some cells had no detectable mEPSCs, leading to higher variability in the mean frequencies.) Mean ± SEM, compiled from 6 to 16 cells per time point. Asterisks = P < 0.05, Student's t-test between control and FL-treated conditions. (D) Cumulative fraction plot of mEPSC frequency in neurons grown in control wells or above feeder layers d5–8, N = 10 and 16 cells, respectively. Kolmogorov–Smirnov P < 0.001. (E) Cumulative fraction plot of mEPSC amplitude in neurons grown in control wells or above feeder layers d5–9, N = 279 and 1075 mEPSCs, from 11 and 12 cells, respectively. Kolmogorov–Smirnov P < 0.001. (F) Example traces from a control neuron, or a FL-treated neuron before, during and after perfusion of the AMPA receptor blocker NBQX (10μM) to demonstrate blockade followed by recovery of mEPSCs. Blockade and recovery observed in 6 of 6 cells tested; 1 example shown. (G, H) Electron micrographs demonstrating typical diffuse scattering of synaptic vesicles in 7 d.i.v. control cells (G) and a typical synapse in a neuron exposed to a cortical feeder layer from 5 to 7 d.i.v. (H). Arrowheads: examples of vesicles. Arrow: postsynaptic density. Scale bar = 500nm. (I) Numbers of clusters of 10 or more vesicles in a radius approximately 5 μm out from each soma. Mean ± SEM. N = 21 cells per condition in 3 experiments, P < 0.01, Student's t-test.
Figure 4.
Figure 4.
Rapid synaptogenesis enables microarray experiments, validated by QPCR. (A) Subplate neurons exposed to a cortical feeder layer for increasing durations, beginning at 5 d.i.v. Fold synaptogenesis = number of colocalized synapsin and PSD-95 puncta per μm2 of actin-stained neurite, normalized to control cultures. Asterisks = P < 0.05, N.S. = nonsignificant, Student's t-test between FL-treated and respective control. Compiled from 4 experiments, 8 images per coverslip. (B) Validation of microarray results by comparison of expression ratio of selected genes in control and feeder layer-treated cultures, in microarray versus QPCR experiments (plotted logarithmically), using separate biological replicates of experiments. Microarrays: 5 replicates, QPCR: 3–4 replicates per gene. Expression ratio = expression in feeder layer-treated cells versus control cells. Note that data points fall only in the 2 quadrants, indicating that gene expression changed in the same direction on microarrays as in QPCR for every gene.
Figure 5.
Figure 5.
In vivo expression patterns of selected genes that were regulated during periods of synaptogenesis in cultures. Sagittal sections from mouse brain at the indicated ages, shown with dorsal to top, rostral to right. Dark-field images of silver grains from isotopic in situ hybridization, for selected mRNAs whose regulation by feeder layer exposure was confirmed by QPCR. Arrows: upper layers of cortex, showing higher mRNA expression for many of these genes. Scale bar = 1 mm.

Comment in

References

    1. Allendoerfer KL, Shatz CJ. The subplate, a transient neocortical structure: its role in the development of connections between thalamus and cortex. Annu Rev Neurosci. 1994;17:185–218. - PubMed
    1. Allendoerfer KL, Shelton DL, Shooter EM, Shatz CJ. Nerve growth factor receptor immunoreactivity is transiently associated with the subplate neurons of the mammalian cerebral cortex. Proc Natl Acad Sci USA. 1990;87:187–190. - PMC - PubMed
    1. Anwyl R. Metabotropic glutamate receptors: electrophysiological properties and role in plasticity. Brain Res Brain Res Rev. 1999;29:83–120. - PubMed
    1. Ashburner M, Ball CA, Blake JA, Botstein D, Butler H, Cherry JM, Davis AP, Dolinski K, Dwight SS, Eppig JT, et al. Gene ontology: tool for the unification of biology. The Gene Ontology Consortium. Nat Genet. 2000;25:25–29. - PMC - PubMed
    1. Barrett T, Troup DB, Wilhite SE, Ledoux P, Rudnev D, Evangelista C, Kim IF, Soboleva A, Tomashevsky M, Edgar R. NCBI GEO: mining tens of millions of expression profiles—database and tools update. Nucleic Acids Res. 2007;35:D760–D765. - PMC - PubMed

Publication types

MeSH terms