. 2009 Jan 15;587(2):443-60.
doi: 10.1113/jphysiol.2008.163162. Epub 2008 Nov 24.

Calsequestrin content and SERCA determine normal and maximal Ca2+ storage levels in sarcoplasmic reticulum of fast- and slow-twitch fibres of rat

Affiliations

Calsequestrin content and SERCA determine normal and maximal Ca2+ storage levels in sarcoplasmic reticulum of fast- and slow-twitch fibres of rat

Robyn M Murphy et al. J Physiol. .

Abstract

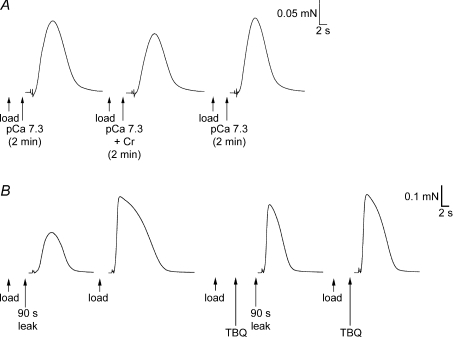
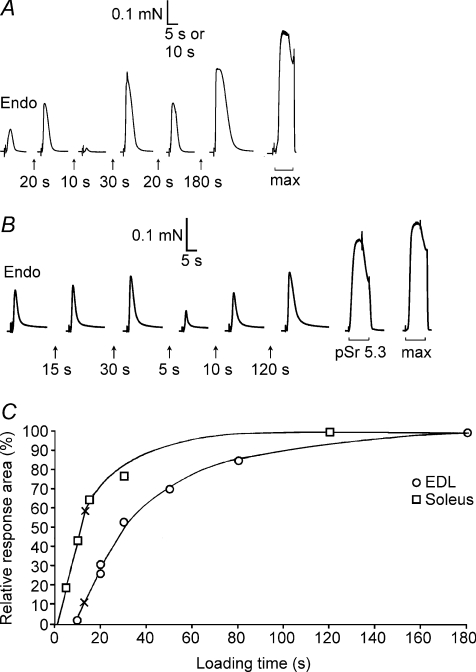
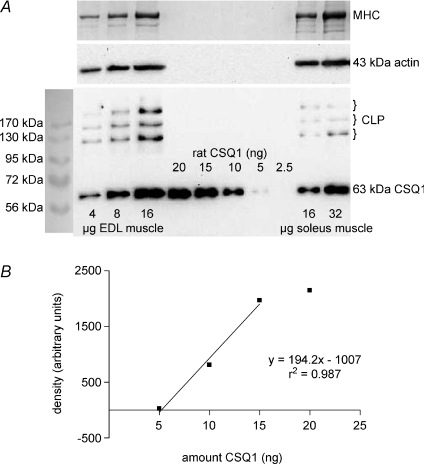
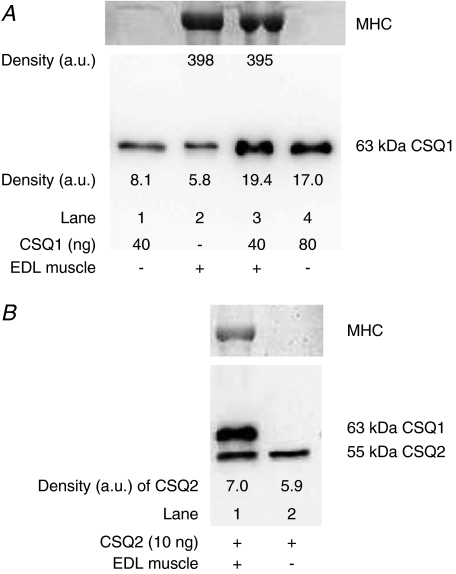
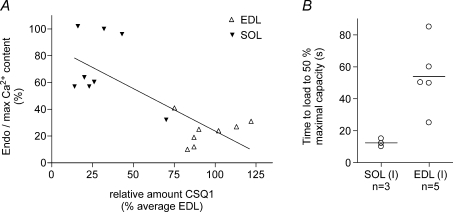
Whilst calsequestrin (CSQ) is widely recognized as the primary Ca2+ buffer in the sarcoplasmic reticulum (SR) in skeletal muscle fibres, its total buffering capacity and importance have come into question. This study quantified the absolute amount of CSQ isoform 1 (CSQ1, the primary isoform) present in rat extensor digitorum longus (EDL) and soleus fibres, and related this to their endogenous and maximal SR Ca2+ content. Using Western blotting, the entire constituents of minute samples of muscle homogenates or segments of individual muscle fibres were compared with known amounts of purified CSQ1. The fidelity of the analysis was proven by examining the relative signal intensity when mixing muscle samples and purified CSQ1. The CSQ1 contents of EDL fibres, almost exclusively type II fibres, and soleus type I fibres [SOL (I)] were, respectively, 36 +/- 2 and 10 +/- 1 micromol (l fibre volume)(-1), quantitatively accounting for the maximal SR Ca2+ content of each. Soleus type II [SOL (II)] fibres (approximately 20% of soleus fibres) had an intermediate amount of CSQ1. Every SOL (I) fibre examined also contained some CSQ isoform 2 (CSQ2), which was absent in every EDL and other type II fibre except for trace amounts in one case. Every EDL and other type II fibre had a high density of SERCA1, the fast-twitch muscle sarco(endo)plasmic reticulum Ca2+-ATPase isoform, whereas there was virtually no SERCA1 in any SOL (I) fibre. Maximal SR Ca2+ content measured in skinned fibres increased with CSQ1 content, and the ratio of endogenous to maximal Ca2+ content was inversely correlated with CSQ1 content. The relative SR Ca2+ content that could be maintained in resting cytoplasmic conditions was found to be much lower in EDL fibres than in SOL (I) fibres (approximately 20 versus >60%). Leakage of Ca2+ from the SR in EDL fibres could be substantially reduced with a SR Ca2+ pump blocker and increased by adding creatine to buffer cytoplasmic [ADP] at a higher level, both results indicating that at least part of the Ca2+ leakage occurred through SERCA. It is concluded that CSQ1 plays an important role in EDL muscle fibres by providing a large total pool of releasable Ca2+ in the SR whilst maintaining free [Ca2+] in the SR at sufficiently low levels that Ca2+ leakage through the high density of SERCA1 pumps does not metabolically compromise muscle function.


Figures

Figure 7
Figure 7. Effects on SR Ca2+ leakage of raising [ADP] with Cr or blocking SERCA with TBQ
A, force responses in a skinned EDL fibre upon emptying the SR of Ca2+. On each load–release cycle the SR was loaded to the same set level (approximately the endogenous level), and then equilibrated in solution at pCa 7.3 (1 mm total EGTA) with or without 3 mm Cr present. Following exposure to the solution with Cr present (which raised [ADP] to ∼10 μm), the SR Ca2+ content was relatively reduced. B, force responses in another EDL skinned fibre in which the SR was loaded with Ca2+ (by a 30 s period followed by a further 10 s period), with or without a subsequent 90 s leakage period (in a solution at ∼pCa 9 with 2 mm free EGTA; see two left-most traces). The procedure was then repeated with 25 μm TBQ present during the leakage period (TBQ added during the second, 10 s, part of the load procedure). Loss of SR Ca2+ during the 90 s leakage period was greatly reduced in the presence of TBQ. The TBQ was removed between each cycle (see Methods). Bracketing control and other load–leak cycles in the sequence are not shown.
Figure 6
Figure 6. Changes in SR Ca2+ content in skinned fibres maintained at pCa 7.3
A, force responses in a skinned EDL fibre upon emptying SR of Ca2+ in repeated load–release cycles as in Fig. 4. The SR was loaded to the same level (approximately endogenous level) on each repetition shown; the reduced area of the force response in the middle trace indicates that the SR lost net Ca2+ during the 2 min period in solution at pCa 7.3 (1 mm total EGTA; Cr added to buffer ADP at ∼10 μm; see main text). B, similar responses in a SOL (I) fibre, which displayed a small increase in SR Ca2+ content after 2 min in the pCa 7.3 solution. The EDL and SOL (I) fibres shown were typical of type: CSQ1 75 and 23% of EDL average, CSQ2 absent and present, and SERCA1 amounts 135 and ∼1% of EDL average, respectively.
Figure 4
Figure 4. Assay of SR Ca2+ content and loading properties in fibres with known CSQ
A, force responses of skinned EDL fibre segment upon releasing all SR Ca2+ by exposure to 30 mm caffeine–low [Mg2+] solution. First response (‘Endo’) reflects release of endogenous Ca2+ content. The SR was reloaded by bathing the segment for the indicated time in solution at pCa 6.7 with 1.0 mm total EGTA. Maximal Ca2+-activated force (in response to ‘max’ solution) is shown on a slower time scale. The fibre segment had ∼120% of average EDL CSQ1 content, no CSQ2 and typical EDL SERCA1 content. B, force responses in SOL (I) fibre; high relative force response in solution with pSr 5.3 indicates type I fibre. Calsequestrin 1 content was ∼20% of EDL average, typical SOL level of CSQ2, and SERCA1 was not determined. C, time integral of force responses versus load time for fibres in A and B, expressed as a percentage of the maximal value. Crosses indicate the time required to reload SR Ca2+ to the level present endogenously. In A and B, the force artefacts upon changing solution (start of each record) are shown on a compressed time scale.
Figure 1
Figure 1. Quantification of CSQ1 in rat EDL and soleus muscle homogenates
A, protein from rat EDL and soleus whole muscle homogenates (4–32 μg muscle wet weight, as indicated) and 2.5–20 ng purified CSQ1 (prepared from rat skeletal muscle), were separated on a 10% SDS-PAGE gel and CSQ1 detected by Western blotting (anti-CSQ1). To verify relative amounts of muscle loaded, membranes were reprobed for actin (middle panel), and also gels were stained with Coomassie Blue following transfer to identify myosin heavy chain (MHC, top panel). Calsequestrin-like proteins (CLP) were also observed in all homogenate samples. B, density of band for purified CSQ1 plotted against amount of protein. Amount of CSQ1 in EDL and soleus homogenates (1.55 and 0.56 ng (μg muscle wet weight)−1, respectively) determined from intensity of bands that fell within linear range for samples of purified CSQ1 on the same gel (shown in A).
Figure 2
Figure 2. Verification of CSQ quantification by adding pure CSQ to muscle homogenates
A, lower panel shows Western blot (probed with anti-CSQ1) of lanes containing purified CSQ1 alone (40 ng, lane 1; 80 ng, lane 4), EDL muscle homogenate alone (lane 2), or the same amount of muscle homogenate with 40 ng added CSQ1 (lane 3). Post-transfer Coomassie Blue staining of the gel for MHC (upper panel) verified that lanes with muscle homogenate had a similar amount loaded. Density values for CSQ1 and MHC are indicated. Band densities indicate that the mixture of purified CSQ1 and muscle homogenate CSQ1 was transferred, detected and quantified with similar efficacy as purified CSQ1 run by itself (also see Results). B, similar to A, but with 10 ng pure CSQ2 added to lanes 1 and 2 and EDL muscle homogenate present in lane 1 only (probed with anti-CSQ1 and 2). The EDL muscle contains virtually no CSQ2, and it is apparent that the detection of the exogenous CSQ2 was not hindered by the proteins present in the whole muscle sample; CSQ1 was also detected in the muscle sample.
Figure 3
Figure 3. Calsequestrin 1, CSQ2 and SERCA1 in segments of individual muscle fibres
A, entire constituents of a segment of an individual EDL fibre (extreme left) and a soleus fibre (SOL, extreme right) were separated on a 10% SDS-PAGE gel, and CSQ1 and CSQ2 detected by Western blotting (anti-CSQ1 and 2). The blot was reprobed for SERCA1, and also for actin as an indicator of the relative amount of fibre added. Post-transfer Coomassie Blue staining for MHC (top panel) also confirmed that approximately equal amounts of the EDL and SOL fibre were run. Calsequestrin 1 content was much greater in the EDL fibre than in the SOL fibre, whereas CSQ2 was present only in the SOL fibre. B, Western blot comparing CSQ1 and CSQ2 contents in segments of 7 SOL (I) fibres and 2 SOL (II) fibres, calibrated by indicated amounts of purified CSQ1 (5–15 ng, rabbit) and CSQ2 (2–10 ng, human); (anti-CSQ1 and 2 and anti-CSQ1). The relative amount of fibre present is indicated by MHC stain (top panel). Fibre type was determined beforehand from the contractile response of the fibre segment to pSr 5.3 solution (see Methods and Fig. 4). The SOL (II) fibres contained more CSQ1 than SOL (I) fibres, and had a high density of SERCA1 but no CSQ2. C, relative amounts of CSQ1 in individual fibres from different muscles. Amounts of CSQ1 were derived from the standard curve for purified CSQ1 on the same gel, normalized by MHC content and expressed as a percentage of the mean value for EDL fibres on the same gel. In two SOL (II) cases (crossed circles) there were no EDL fibres on the same gel (shown in B), and values were first normalized to the mean of SOL (I) fibres on that gel and then rescaled by the ratio of mean values of EDL to SOL (I) fibres. The SOL (I) fibres were significantly different from EDL, RG (II) and SOL (II), and the SOL (II) and RG (II) fibres were significantly different from EDL fibres; one-way ANOVA with Newman–Keuls post hoc analyses. D, 8% gel Stains-All of 30 μg of protein loaded for EDL (2nd lane), soleus (3rd lane) and heart muscle preparations (4th lane; see Methods). Purified CSQ1 and CSQ2 (5 μg each) were loaded in the same lane. The sizes of two different molecular weight markers, applied to either side of the gel, are indicated (MWt).
Figure 5
Figure 5. Relationship between CSQ1 amount and Ca2+ content in single fibres
A, endogenous Ca2+ content present in SR in a fibre segment expressed as a percentage of maximal Ca2+ content (see Fig. 4) plotted against the amount of CSQ1 in the fibre segment. Calsequestrin 1 in the fibre segment is expressed relative to the mean for EDL fibres on the same gel (see Fig. 3). Linear regression analysis indicates a significant inverse relationship (r2= 0.55, P < 0.005). B, time taken to reload SR to 50% of maximal capacity (see Fig. 4; load solution at pCa 6.7 with moderate Ca2+ buffering; 0.5 mm CaEGTA, 0.5 mm free EGTA). Lines indicate means for the two fibre types. Calsequestrin 1 was present in EDL fibres at 83–102% of EDL average, and in soleus fibres at 14–32%. In both A and B, all soleus fibres were shown to be type I by Sr2+ sensitivity. Calsequestrin 2 was present in all SOL (I) fibres and absent in all EDL fibres. SERCA1 was present at high density in all EDL fibres and negligible in all SOL (I) fibres; not measured in one fibre of each type in B.

References

    1. Ahern GP, Junankar PR, Dulhunty AF. Single channel activity of the ryanodine receptor calcium release channel is modulated by FK-506. FEBS Lett. 1994;352:369–374. - PubMed
    1. Allen DG, Lamb GD, Westerblad H. Skeletal muscle fatigue: cellular mechanisms. Physiol Rev. 2008;88:287–332. - PubMed
    1. Bakker AJ, Lamb GD, Stephenson DG. The effect of 2,5-di-(tert-butyl)-1,4-hydroquinone on force responses and the contractile apparatus in mechanically skinned muscle fibres of the rat and toad. J Muscle Res Cell Motil. 1996;17:55–67. - PubMed
    1. Baylor SM, Chandler WK, Marshall MW. Sarcoplasmic reticulum calcium release in frog skeletal muscle fibres estimated from Arsenazo III calcium transients. J Physiol. 1983;344:625–666. - PMC - PubMed
    1. Beard NA, Casarotto MG, Wei L, Varsángi M, Laver DR, Dulhunty AF. Regulation of ryanodine receptors by calsequestrin: effect of high luminal Ca2+ and phosphorylation. Biophysical J. 2005;88:3444–3454. - PMC - PubMed

Publication types

MeSH terms

LinkOut - more resources