Comparative Study
. 2009 Jan;15(1):21-32.
doi: 10.1261/rna.1399509. Epub 2008 Nov 24.

Deadenylation is a widespread effect of miRNA regulation

Affiliations
Comparative Study

Deadenylation is a widespread effect of miRNA regulation

Ana Eulalio et al. RNA. 2009 Jan.

Abstract

miRNAs silence gene expression by repressing translation and/or by promoting mRNA decay. In animal cells, degradation of partially complementary miRNA targets occurs via deadenylation by the CAF1-CCR4-NOT1 deadenylase complex, followed by decapping and subsequent exonucleolytic digestion. To determine how generally miRNAs trigger deadenylation, we compared mRNA expression profiles in D. melanogaster cells depleted of AGO1, CAF1, or NOT1. We show that approximately 60% of AGO1 targets are regulated by CAF1 and/or NOT1, indicating that deadenylation is a widespread effect of miRNA regulation. However, neither a poly(A) tail nor mRNA circularization are required for silencing, because mRNAs whose 3' ends are generated by a self-cleaving ribozyme are also silenced in vivo. We show further that miRNAs trigger mRNA degradation, even when binding by 40S ribosomal subunits is inhibited in cis. These results indicate that miRNAs promote mRNA decay by altering mRNP composition and/or conformation, rather than by directly interfering with the binding and function of ribosomal subunits.


Figures

FIGURE 1.
FIGURE 1.
Expression profiles of D. melanogaster S2 cells depleted of AGO1, CAF1, or NOT1. (A) S2 cells were treated with the dsRNAs indicated below the lanes. The number (nb) of independent expression profiles obtained per depleted protein is indicated in brackets. The average expression levels of transcripts detectable in all profiles (6208 mRNAs) are shown. RNAs are represented as lines colored relative to their expression levels, as indicated on the left. Numbers above the lanes indicate rank correlation coefficients relative to AGO1, CAF1, or NOT1. The experiment tree was calculated using the distance option in the GeneSpring software (Euclidean distance). (B) RNAs at least 1.5-fold overrepresented in the two independent profiles obtained for AGO1. (C) RNAs at least 1.5-fold overrepresented in at least four of five profiles obtained for CAF1 and NOT1. (D) RNAs at least 1.5-fold overrepresented in the two independent profiles obtained for AGO1 and in at least four of five profiles obtained for CAF1 and NOT1. (E) RNAs at least 1.5-fold overrepresented in the two independent profiles obtained for AGO and <1.5-fold up-regulated in at least four of five profiles obtained for CAF1 and NOT1. (F) RNAs at least 1.5-fold overrepresented in at least four of five profiles obtained for CAF1 and NOT1 and <1.5-fold up-regulated in the two profiles obtained for AGO1. The number of mRNAs displayed per panel is indicated in brackets. Note that the lines representing individual mRNAs are compressed in A.
FIGURE 2.
FIGURE 2.
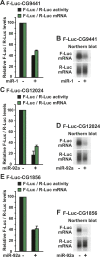
Validation of the array data. (A–F) S2 cells were transfected with a mixture of three plasmids: one expressing a firefly luciferase (F-Luc) transcript, followed by the indicated 3′ UTRs; another expressing the miRNA primary transcripts (+miRNA) or the corresponding empty vector (−); and a third expressing Renilla luciferase (R-Luc). Firefly luciferase activity (black bars) and mRNA levels (green bars) were normalized to that of the Renilla luciferase. The normalized values of F-Luc activity and mRNA levels were set to 100 in cells transfected with the empty vector (i.e., in the absence of the miRNAs). Mean values ± standard deviations from three independent experiments are shown. (B,D,F) Northern blot analysis of representative RNA samples shown in A, C, and E, respectively.
FIGURE 3.
FIGURE 3.
miRNAs trigger deadenylation-dependent decapping. (A–F) S2 cells were treated with the indicated dsRNAs on days 0 and 4. On day 6, cells were cotransfected with a mixture of three plasmids: one expressing a Firefly luciferase (F-Luc) transcript containing the indicated 3′ UTRs, another expressing the miR-92a primary transcript (+) or the corresponding empty vector (–), and a third expressing Renilla luciferase (R-Luc). Firefly luciferase activity and mRNA levels were normalized to that of the Renilla luciferase. For each knockdown, the normalized values of F-Luc activity and mRNA levels were set to 100 in cells transfected with the empty vector, i.e., in the absence of the miRNA (data not shown except for control cells treated with GFP dsRNA). Black and green dashed lines indicate F-Luc activity and mRNA levels, respectively, in the presence of the miRNAs in control cells. Mean values ± standard deviations from three independent experiments are shown. (C,E) Northern blot analysis of representative RNA samples shown in A and B, respectively. (D,F) The RNA samples corresponding to the Ge-1 and Me31B knockdowns shown in C and E were treated with RNase H in the absence or presence of oligo(dT) and analyzed by Northern blot. The endogenous rp49 mRNA served as a positive control for RNase H treatment.
FIGURE 4.
FIGURE 4.
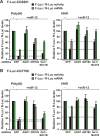
Deadenylation is not required for silencing. (A,B) S2 cells were transfected with F-Luc reporters ending with a 3′ poly(A) tail or a self-cleavable ribozyme (HhR), as indicated. The transfection mixture included either a plasmid expressing the miR-12 primary transcript (+) or the corresponding empty vector (–). A plasmid expressing Renilla luciferase (R-Luc) served as a transfection control. Firefly luciferase activity and mRNA levels were analyzed as described in Figure 2. Northern blot analysis of representative RNA samples is shown below the corresponding graphs. (C) RNA samples corresponding to the HhR reporters were treated with RNase H in the absence or presence of oligo(dT) and analyzed by Northern blot. The endogenous rp49 mRNA served as a positive control for the RNase H treatment.
FIGURE 5.
FIGURE 5.
GW182 and decapping activators are required for silencing unadenylated mRNAs. (A,B) S2 cells were treated with the indicated dsRNAs on days 0 and 4. On day 6, cells were cotransfected with a mixture of three plasmids: one expressing a Firefly luciferase (F-Luc) transcript containing the indicated 3′ UTRs, another expressing the miR-12 primary transcript (+) or the corresponding empty vector (−), and a third expressing Renilla luciferase (R-Luc). Samples were analyzed as described in Figure 4.
FIGURE 6.
FIGURE 6.
Deadenylation is not required for silencing by tethered AGO1 or GW182. (A) Schematic representation of the F-Luc-5BoxB reporters carrying 5BoxB elements inserted in their 3′ UTRs. The cleavage and polyadenylation signal of the F-Luc-5BoxB reporter was substituted either with a histone H4 3′-terminal stem–loop (HSL) or a self-cleavable hammerhead ribozyme (HhR). (B–G) S2 cells were transfected with a mixture of three plasmids: one expressing the F-Luc-5BoxB reporters shown in A or the corresponding reporters lacking the 5BoxB sequences (F-Luc), another expressing Renilla luciferase, and a third expressing the λN-HA-peptide (Control) or λN-HA fusions of wild-type AGO1 or GW182, as indicated. For each reporter, firefly luciferase activity and mRNA levels were normalized to those of the Renilla and set to 100 in cells expressing the λN-HA-peptide alone (Control). Mean values ± standard deviations from three independent experiments are shown. Northern blot analysis of representative RNA samples is shown for the F-Luc-5BoxB reporters below the corresponding graphs. RNA samples shown in B, C, and D (control lanes) were treated with RNase H in the absence or presence of oligo(dT) and analyzed by Northern blot. The endogenous rp49 mRNA served as a positive control for the RNase H treatment.
FIGURE 7.
FIGURE 7.
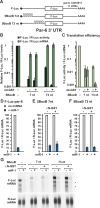
Uncoupling mRNA degradation from translation. (A) Schematic representation of the F-Luc reporters with 5BoxB elements inserted at position 7 or 73 of their 5′ UTRs. The initiation codon is located at position 105. (B,C) S2 cells were transfected with a mixture of three plasmids: one expressing one of the F-Luc-par-6 reporters shown in A, another expressing Renilla luciferase (R-Luc), and a third expressing a λN-HA fusion of GST (Glutathione-S-transferase), as indicated. F-Luc activity and mRNA levels were normalized to those of the Renilla luciferase and set to 1 for the reporter lacking the 5BoxB elements. In C, the normalized levels of F-Luc activity were divided by the normalized levels of F-Luc mRNA for each reporter. Mean values ± standard deviations from three independent experiments are shown. Note that in B and C the scale on the y-axis is logarithmic. (D–G) S2 cells were cotransfected with a mixture of plasmids expressing the F-Luc reporters shown in A, a plasmid expressing the miR-1 primary transcript (+; blue bars) or the corresponding empty vector (−; gray bars), plus a plasmid expressing Renilla luciferase (R-Luc). A plasmid expressing a λN-HA fusion of GST was included in the transfection mixtures as indicated. F-Luc mRNA levels were normalized to that of the Renilla luciferase and set to 100 in cells transfected with the empty vector (i.e., in the absence of the miRNA; gray bars) for each reporter. Mean values ± standard deviations from three independent experiments are shown. (G) Northern blot analysis of representative RNA samples shown in D–F. Asterisks indicate the position of transcripts generated by alternative polyadenylation sites in the par-6 3′ UTR. These alternative polyadenylation sites are located downstream of the predicted miR-1 binding sites.
FIGURE 8.
FIGURE 8.
Uncoupling mRNA degradation from translation. (A–F) Experiments similar to those described in Figure 7 were performed with the F-Luc-CG10011 reporters shown in Figure 7A. Samples were analyzed as described in Figure 7.

References

    1. Adamson T.E., Price D.H. Cotranscriptional processing of D. melanogaster histone mRNAs. Mol. Cell. Biol. 2003;23:4046–4055. - PMC - PubMed
    1. Alemán L.M., Doench J., Sharp P.A. Comparison of siRNA-induced off-target RNA and protein effects. RNA. 2007;13:385–395. - PMC - PubMed
    1. Bagga S., Bracht J., Hunter S., Massirer K., Holtz J., Eachus R., Pasquinelli A.E. Regulation by let-7 and lin-4 miRNAs results in target mRNA degradation. Cell. 2005;122:553–563. - PubMed
    1. Baek D., Villén J., Shin C., Camargo F.D., Gygi S.P., Bartel D.P. The impact of microRNAs on protein output. Nature. 2008;455:64–71. - PMC - PubMed
    1. Behm-Ansmant I., Rehwinkel J., Doerks T., Stark A., Bork P., Izaurralde E. mRNA degradation by miRNAs and GW182 requires both CCR4:NOT deadenylase and DCP1:DCP2 decapping complexes. Genes & Dev. 2006a;20:1885–1898. - PMC - PubMed

Publication types

MeSH terms