. 2008 Dec;40(12):1499-504.
doi: 10.1038/ng.280.

Molecular characterization of clonal interference during adaptive evolution in asexual populations of Saccharomyces cerevisiae

Affiliations

Molecular characterization of clonal interference during adaptive evolution in asexual populations of Saccharomyces cerevisiae

Katy C Kao et al. Nat Genet. 2008 Dec.

Abstract

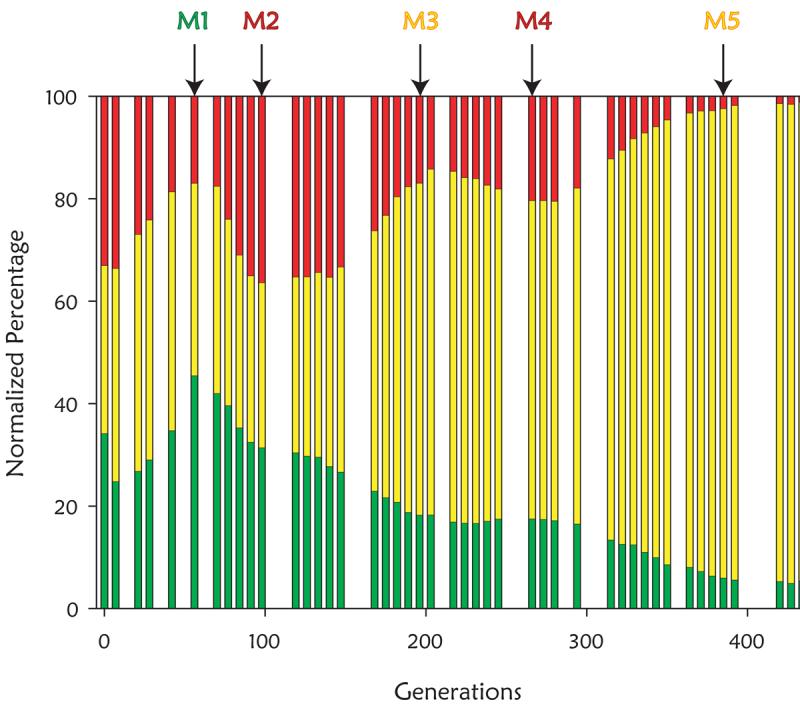
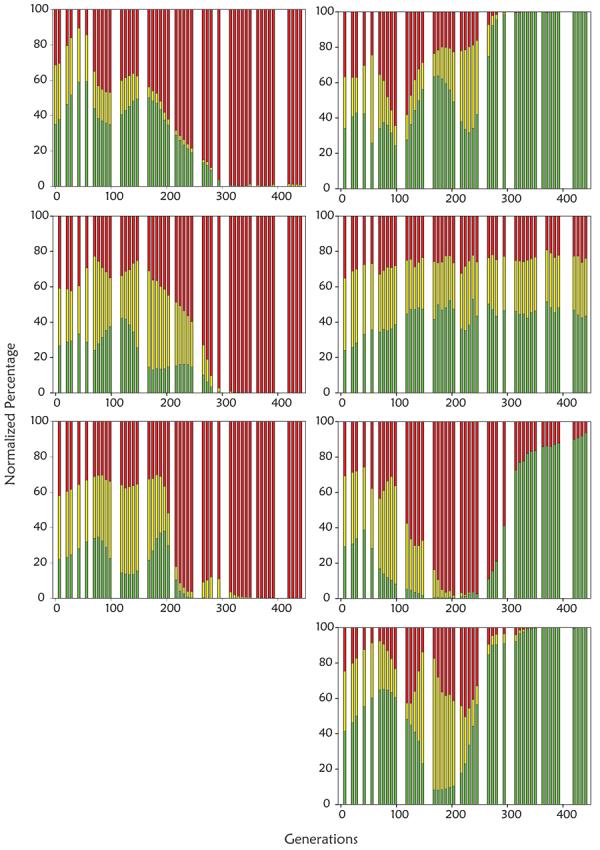
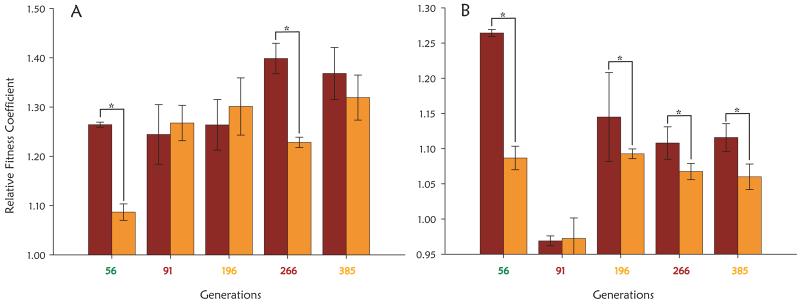
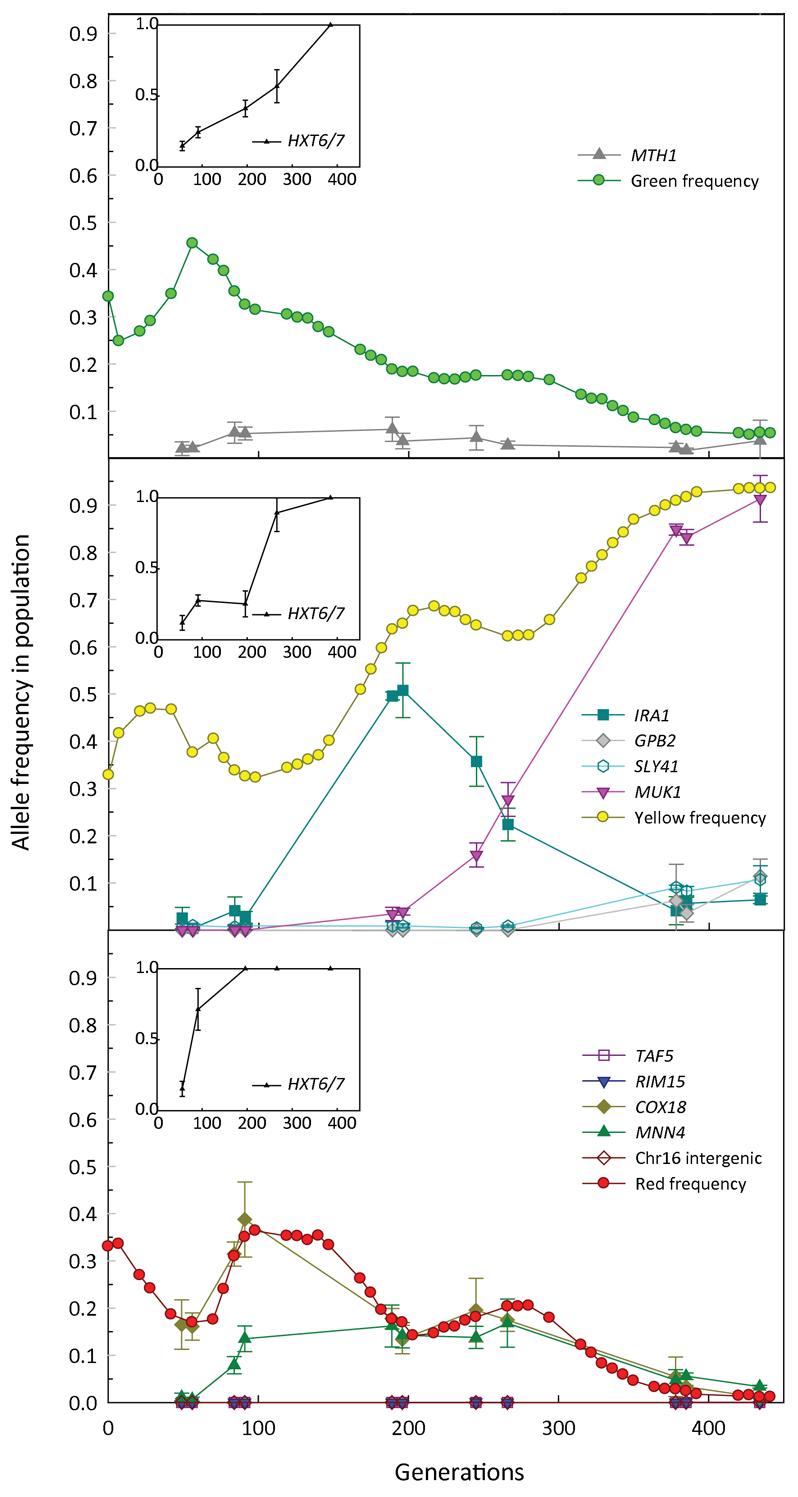
The classical model of adaptive evolution in an asexual population postulates that each adaptive clone is derived from the one preceding it. However, experimental evidence has suggested more complex dynamics, with theory predicting the fixation probability of a beneficial mutation as dependent on the mutation rate, population size and the mutation's selection coefficient. Clonal interference has been demonstrated in viruses and bacteria but not in a eukaryote, and a detailed molecular characterization is lacking. Here we use three different fluorescent markers to visualize the dynamics of asexually evolving yeast populations. For each adaptive clone within one of our evolving populations, we identified the underlying mutations, monitored their population frequencies and used microarrays to characterize changes in the transcriptome. These results represent the most detailed molecular characterization of experimental evolution to date and provide direct experimental evidence supporting both the clonal interference and the multiple mutation models.


Figures

Fig 1
Fig 1
Population dynamics during evolution. The green, red, and yellow bars represent the proportions of each subpopulation of the population as a whole at each generation. A. Experimental population (size of approximately 109 cells) from which adaptive clones marked M1-M5 were isolated and subsequently characterized. The times when putative adaptive subpopulations reach their maxima are marked with arrows. Consistent with previous reports, these adaptive events occur in the glucose-limited population approximately every 50-100 generations. B. Population dynamics of seven additional populations evolved under glucose limitation. The populations on the right contain approximately108 cells, while the populations on the left contain approximately 109 cells.
Fig 1
Fig 1
Population dynamics during evolution. The green, red, and yellow bars represent the proportions of each subpopulation of the population as a whole at each generation. A. Experimental population (size of approximately 109 cells) from which adaptive clones marked M1-M5 were isolated and subsequently characterized. The times when putative adaptive subpopulations reach their maxima are marked with arrows. Consistent with previous reports, these adaptive events occur in the glucose-limited population approximately every 50-100 generations. B. Population dynamics of seven additional populations evolved under glucose limitation. The populations on the right contain approximately108 cells, while the populations on the left contain approximately 109 cells.
Fig 2
Fig 2
Fitness coefficients of adaptive clones (in brown) and adaptive subpopulations (the color of the subpopulation is designated by the color of the generation number under each measurement) from which the adaptive clones were isolated (in orange) versus A) the original parents and B) the immediately preceding adaptive clone, measured in triplicate. Error bars are +/− one standard deviation from the mean. Fitness coefficients of adaptive clones that are statistically different from the adaptive subpopulation they were isolated from, as determined using a one tailed t-test with p-value cut off of 0.05, are denoted with an asterisk.
Fig 3
Fig 3
The frequencies of the observed alleles in the entire population, and the frequencies of HXT amplifications within each of the subpopulations; the green subpopulation shown in top panel, yellow subpopulation in the middle panel, and the red subpopulation in the bottom panel. Since the HXT6/7 amplification estimation was not as accurate as for the other mutations, and is a measure of the mean copy number within the subpopulation (see Supplementary Materials), it is plotted separately from the other allele frequencies, in the inset boxes. The red, yellow and green circles denote the frequency of those fluorescently labeled subpopulations.

References

    1. Muller HJ. Some genetic aspects of sex. American Naturalist. 1932;66:118–138.
    1. Helling RB, Vargas CN, Adams J. Evolution of Escherichia coli during Growth in a Constant Environment. Genetics. 1987;116:349–358. - PMC - PubMed
    1. Notley-McRobb L, Ferenci T. The generation of multiple co-existing mal-regulatory mutations through polygenic evolution in glucose limited populations of Escherichia coli. Environmental Microbiology. 1999;1:45–52. - PubMed
    1. Notley-McRobb L, Ferenci T. Experimental analysis of molecular events during mutational periodic selections in bacterial evolution. Genetics. 2000;156:1493–1501. - PMC - PubMed
    1. Rosenzweig RF, Sharp RR, Treves DS, Adams J. Microbial Evolution in a Simple Unstructured Environment - Genetic Differentiation in Escherichia coli. Genetics. 1994;137:903–917. - PMC - PubMed

Publication types

MeSH terms

Associated data