. 2008 Dec;5(12):1047-52.
doi: 10.1038/nmeth.1274. Epub 2008 Nov 23.

Whole-cell 3D STORM reveals interactions between cellular structures with nanometer-scale resolution

Affiliations

Whole-cell 3D STORM reveals interactions between cellular structures with nanometer-scale resolution

Bo Huang et al. Nat Methods. 2008 Dec.

Abstract

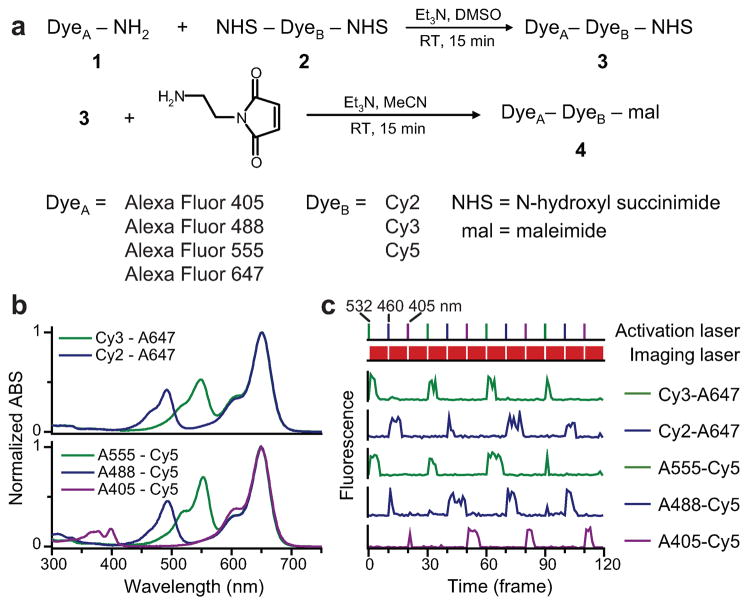
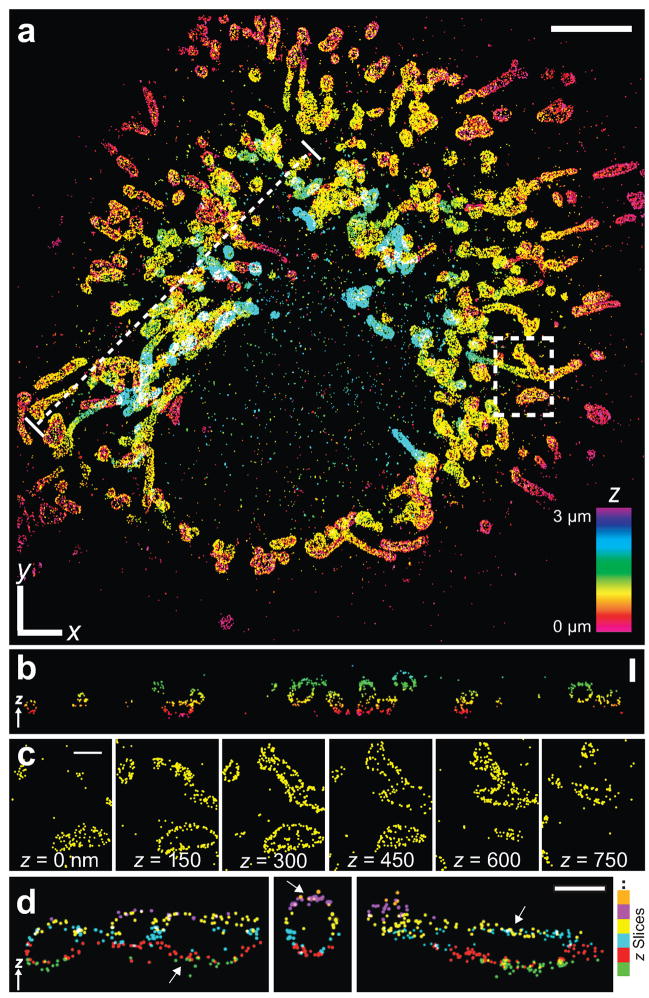
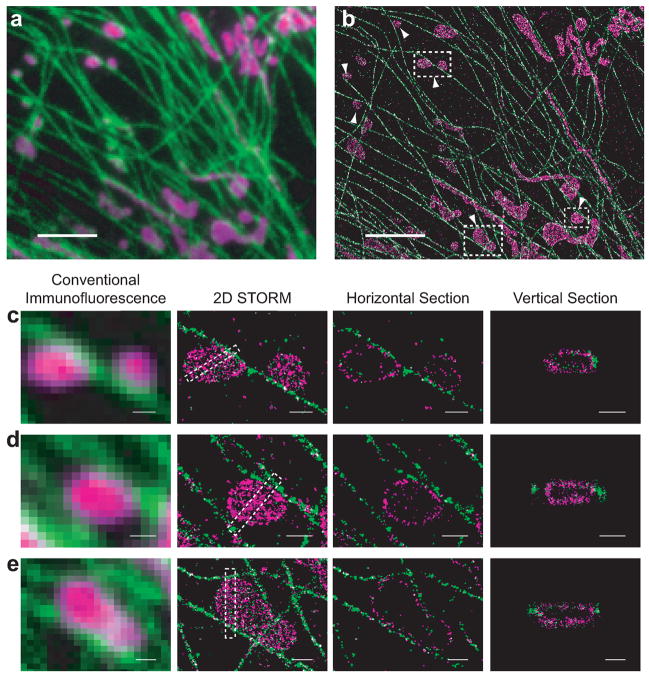
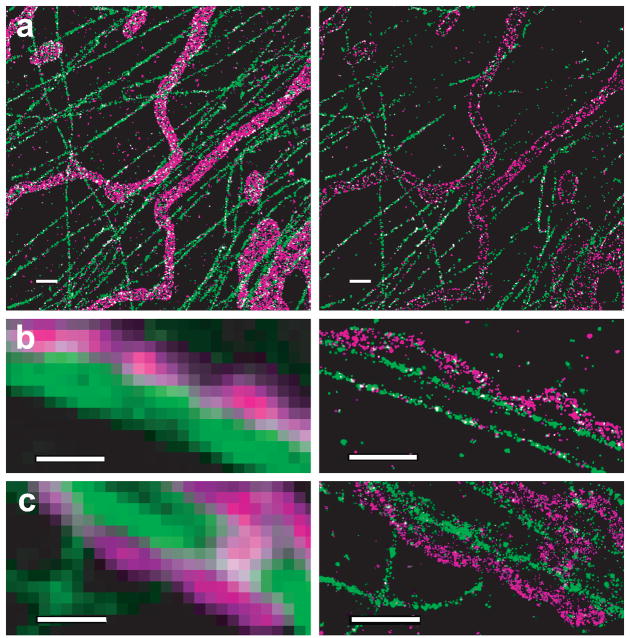
The ability to directly visualize nanoscopic cellular structures and their spatial relationship in all three dimensions will greatly enhance our understanding of molecular processes in cells. Here we demonstrated multicolor three-dimensional (3D) stochastic optical reconstruction microscopy (STORM) as a tool to quantitatively probe cellular structures and their interactions. To facilitate STORM imaging, we generated photoswitchable probes in several distinct colors by covalently linking a photoswitchable cyanine reporter and an activator molecule to assist bioconjugation. We performed 3D localization in conjunction with focal plane scanning and correction for refractive index mismatch to obtain whole-cell images with a spatial resolution of 20-30 nm and 60-70 nm in the lateral and axial dimensions, respectively. Using this approach, we imaged the entire mitochondrial network in fixed monkey kidney BS-C-1 cells, and studied the spatial relationship between mitochondria and microtubules. The 3D STORM images resolved mitochondrial morphologies as well as mitochondria-microtubule contacts that were obscured in conventional fluorescence images.


Figures

Figure 1
Figure 1
Synthesis of covalently linked photoswitchable activator-reporter pairs. (a) Reaction scheme. (b) Absorption spectra of linked dye pairs in PBS at pH 7.4. (c) Photoswitching traces of linked dye pairs showing that they are specifically activated by light matching the absorption wavelength of the activators. The top panel shows the alternating sequence of green (532 nm), blue (460 nm) and violet (405 nm) activation lasers. Between activation pulses, a red (657 nm) laser is used to excite the reporters and to switch them into the dark state (second panel from top). Fluorescence traces of individual probes are shown in the five lower panels.
Figure 2
Figure 2
Three dimensional STORM images of mitochondria in a whole mammalian cell. (a) The 3D STORM image of the mitochondrial network in a BS-C-1 cell. The image is performed in an aqueous medium with refractive index of 1.34. The z-position is color-coded according to the color scale bar. White x-y scale bar: 5 μm. See Supplementary Video 1 online for 3D views. (b) The vertical cross-section along the dotted line in a, showing the hollow shape of individual mitochondria. Scale bar: 1 μm. (c) Consecutive x-y sections of the boxed region in a. Scale bars: 1 μm. (d) Vertical cross-sections of several regions in a, color-coded by the z-slices in which they were originally recorded. Arrows indicate overlapping horizontal segments of mitochondria appearing in adjacent z-slices, where localizations from different slices are colored differently. Scale bar: 750 nm.
Figure 3
Figure 3
Two-color 3D STORM images of mitochondria and microtubules. (a) A conventional fluorescence image of mitochondria (magenta) and microtubules (green) normalized over excitation laser intensities. (b) STORM image of the same area with all localizations at different z positions stacked. The image is acquired in aqueous media and reconstructed from 500,000 localization points. It contains one 650 nm thick image slice. Scale bars: 3 μm. (c–e) Magnified views of the boxed regions in b. Panels from left to right: the conventional fluorescence image, the 2D STORM image, a horizontal cross-section, and the vertical cross-section of the boxed region in the 2D STORM image. See Supplemental Video 2 online for a 3D rendering of e. Scale bars: 500 nm.
Figure 4
Figure 4
Two-color STORM images showing interactions between tubular mitochondria (magenta) and microtubules (green) in three BS-C-1 cells. The imaging conditions are identical to Figure 3. Images shown here are magnified view of the boxed regions of the large-field images shown in Supplementary Fig. 5 online. (a) Comparison of the z-stacked STORM image (left panel) and a 100 nm thick horizontal section displaying hollow tubes of mitochondria (right panel). (b, c) Inchworm-like interactions between tubular mitochondria and microtubules are resolved in STORM images (right panels) but not in conventional fluorescence images (left panels). Scale bars: 1 μm.

References

    1. Hell SW. Far-field optical nanoscopy. Science. 2007;316:1153–1158. - PubMed
    1. Gustafsson MGL. Nonlinear structured-illumination microscopy: Wide-field fluorescence imaging with theoretically unlimited resolution. Proc Natl Acad Sci U S A. 2005;102:13081–13086. - PMC - PubMed
    1. Schmidt R, et al. Spherical nanosized focal spot unravels the interior of cells. Nat Methods. 2008;5:539–544. - PubMed
    1. Rust MJ, Bates M, Zhuang XW. Sub-diffraction-limit imaging by stochastic optical reconstruction microscopy (STORM) Nat Methods. 2006;3:793–795. - PMC - PubMed
    1. Betzig E, et al. Imaging intracellular fluorescent proteins at nanometer resolution. Science. 2006;313:1642–1645. - PubMed

Publication types

MeSH terms