. 2008 Dec;26(12):1373-8.
doi: 10.1038/nbt.1507. Epub 2008 Nov 16.

Integrated barcode chips for rapid, multiplexed analysis of proteins in microliter quantities of blood

Affiliations

Integrated barcode chips for rapid, multiplexed analysis of proteins in microliter quantities of blood

Rong Fan et al. Nat Biotechnol. 2008 Dec.

Abstract

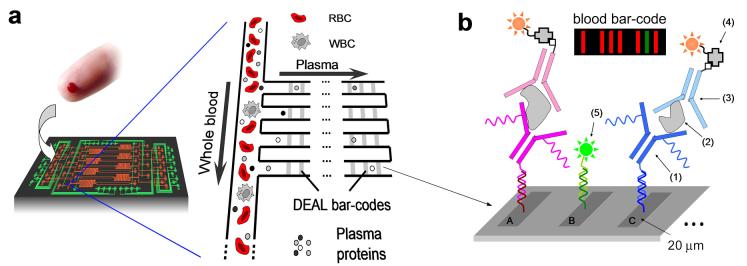
As the tissue that contains the largest representation of the human proteome, blood is the most important fluid for clinical diagnostics. However, although changes of plasma protein profiles reflect physiological or pathological conditions associated with many human diseases, only a handful of plasma proteins are routinely used in clinical tests. Reasons for this include the intrinsic complexity of the plasma proteome, the heterogeneity of human diseases and the rapid degradation of proteins in sampled blood. We report an integrated microfluidic system, the integrated blood barcode chip that can sensitively sample a large panel of protein biomarkers over broad concentration ranges and within 10 min of sample collection. It enables on-chip blood separation and rapid measurement of a panel of plasma proteins from quantities of whole blood as small as those obtained by a finger prick. Our device holds potential for inexpensive, noninvasive and informative clinical diagnoses, particularly in point-of-care settings.


Figures

Figure 1
Figure 1
Design of an integrated blood barcode chip (IBBC). (a) Scheme depicting plasma separation from a fingerprick of blood by harnessing the Zweifach-Fung effect. Multiple DNA-encoded antibody barcode arrays are patterned within the plasma skimming channels for in situ protein measurements. (b) Illustration of DEAL barcode arrays patterned in plasma channels for in situ protein measurement. A, B, C indicate different DNA codes. (1)-(5) denote DNA-antibody conjugate, plasma protein, biotin-labeled detection antibody, streptavidin-Cy5 fluorescence probe, and complementary DNA-Cy3 reference probe, respectively. The inset represents a barcode of protein biomarkers, which is read out using fluorescence detection. The green bar represents an alignment marker.
Figure 2
Figure 2
Measurement of human chorionic gonadotropin(hCG) in sera. (a) Fluorescence images of DEAL barcodes showing the measurement of a series of standard serum samples spiked with hCG. The bars used to measure hCG were patterned with DNA strand A at different concentrations. TNF-α encoded by strand B was employed as a negative control. The green bars (strand M) serve as references. (b) Quantification of the full barcodes for three selective samples. (c) Mean values of fluorescence signals corresponding to three sets of bars with different DNA loadings. The dash lines indicate the typical physiological levels of hCG in sera after one or ten weeks of pregnancy. The length of error bars represents 1SD.
Figure 3
Figure 3
Multiplexed protein measurements of clinical patient sera. (a) Layout of the barcode array used in this study. Green denotes the reference (strand M). (b) Representative fluorescence images of barcodes used in measuring a dozen proteins (the cancer marker PSA and eleven cytokines) from 22 cancer patient serum samples. B01-B11 denote breast cancer patients, P01-P11 denote prostate cancer patients. The left and right columns represent measurements on different chips. (c) Validation of PSA DEAL barcode measurement using ELISA (x denotes PSA measurements were not provided by the serum supplier) (Error bar: 1 standard deviation). (d) Distribution of estimated concentrations of PSA, TNFα and IL1β in all serum samples. The horizontal bars mark the mean values. (e) Complete non-supervised clustering of breast and prostate cancer patients on the basis of protein patterns.
Figure 4
Figure 4
IBBC for the rapid measurement of a panel of serum biomarkers from a finger-prick of whole blood. (a) Optical micrographs showing the effective separation of plasma from fresh whole blood. A few red blood cells were occasionally seen downstream of the plasma channels, but this did not

Comment in

References

    1. Anderson NL, Anderson NG. The human plasma proteome - History, character, and diagnostic prospects. Molecular & Cellular Proteomics. 2002;1:845–867. - PubMed
    1. Fujii K, et al. Clinical-scale high-throughput human plasma proteome clinical analysis: Lung adenocarcinoma. Proteomics. 2005;5:1150–1159. - PubMed
    1. Lathrop JT, Anderson NL, Anderson NG, Hammond DJ. Therapeutic potential of the plasma proteome. Current Opinion in Molecular Therapeutics. 2003;5:250–257. - PubMed
    1. Chen JH, et al. Plasma proteome of severe acute respiratory syndrome analyzed by two-dimensional gel electrophoresis and mass spectrometry. Proceedings of the National Academy of Sciences of the United States of America. 2004;101:17039–17044. - PMC - PubMed
    1. Hsieh SY, Chen RK, Pan YH, Lee HL. Systematical evaluation of the effects of sample collection procedures on low-molecular-weight serum/plasma proteome profiling. Proteomics. 2006;6:3189–3198. - PubMed

Publication types