How should the impact of different presentations of treatment effects on patient choice be evaluated? A pilot randomized trial
- PMID: 19030110
- PMCID: PMC2585274
- DOI: 10.1371/journal.pone.0003693
How should the impact of different presentations of treatment effects on patient choice be evaluated? A pilot randomized trial
Abstract
Background: Different presentations of treatment effects can affect decisions. However, previous studies have not evaluated which presentations best help people make decisions that are consistent with their own values. We undertook a pilot study to compare different methods for doing this.
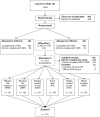
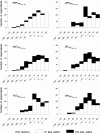
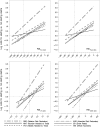
Methods and findings: We conducted an Internet-based randomized trial comparing summary statistics for communicating the effects of statins on the risk of coronary heart disease (CHD). Participants rated the relative importance of treatment consequences using visual analogue scales (VAS) and category rating scales (CRS) with five response options. We randomized participants to either VAS or CRS first and to one of six summary statistics: relative risk reduction (RRR) and five absolute measures of effect: absolute risk reduction, number needed to treat, event rates, tablets needed to take, and natural frequencies (whole numbers). We used logistic regression to determine the association between participants' elicited values and treatment choices. 770 participants age 18 or over and literate in English completed the study. In all, 13% in the VAS-first group failed to complete their VAS rating, while 9% of the CRS-first group failed to complete their scoring (p = 0.03). Different ways of weighting the elicited values had little impact on the analyses comparing the different presentations. Most (51%) preferred the RRR compared to the other five summary statistics (1% to 25%, p = 0.074). However, decisions in the group presented the RRR deviated substantially from those made in the other five groups. The odds of participants in the RRR group deciding to take statins were 3.1 to 5.8 times that of those in the other groups across a wide range of values (p = 0.0007). Participants with a scientific background, who were more numerate or had more years of education were more likely to decide not to take statins.
Conclusions: Internet-based trials comparing different presentations of treatment effects are feasible, but recruiting participants is a major challenge. Despite a slightly higher response rate for CRS, VAS is preferable to avoid approximation of a continuous variable. Although most participants preferred the RRR, participants shown the RRR were more likely to decide to take statins regardless of their values compared with participants who were shown any of the five other summary statistics.
Trial registration: Controlled-Trials.com ISRCTN85194921.
Conflict of interest statement
Figures


References
-
- Kahneman D, Slovic P, Tversky A. Cambridge: Cambridge University Press; 1982. Judgement under uncertainty: heuristics and biases.
-
- Slovic P. London: Earthscan Publications; 2000. The perception of risk.
-
- Ghosh AK, Ghosh K. Translating evidence-based information into effective risk communication: current challenges and opportunities. Journal of Laboratory & Clinical Medicine. 2005;145:171–180. - PubMed
-
- Lipkus IM. Numeric, verbal, and visual formats of conveying health risks: suggested best practices and future recommendations. Medical Decision Making. 2007;27:696–713. - PubMed
Publication types
MeSH terms
Substances
Associated data
LinkOut - more resources
Full Text Sources

