. 2009 Jan 1;199(1):134-41.
doi: 10.1086/594369.

HIV protease inhibitors inhibit the development of preerythrocytic-stage plasmodium parasites

Affiliations

HIV protease inhibitors inhibit the development of preerythrocytic-stage plasmodium parasites

Charlotte V Hobbs et al. J Infect Dis. .

Abstract

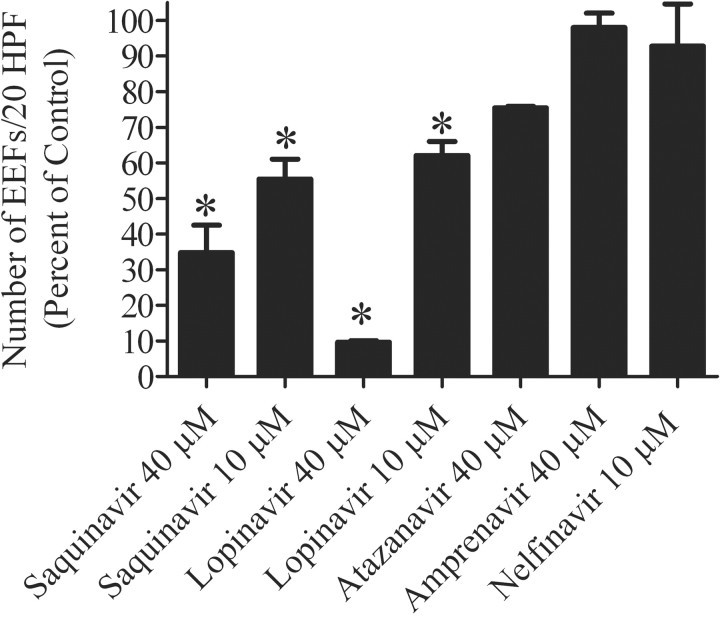
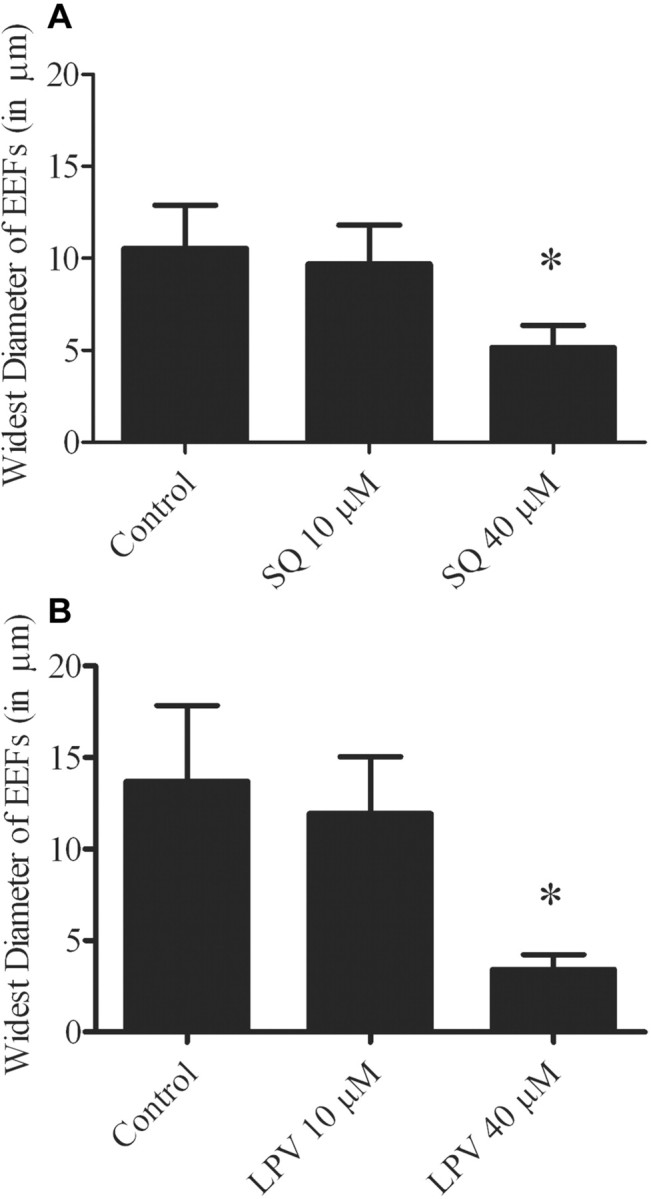
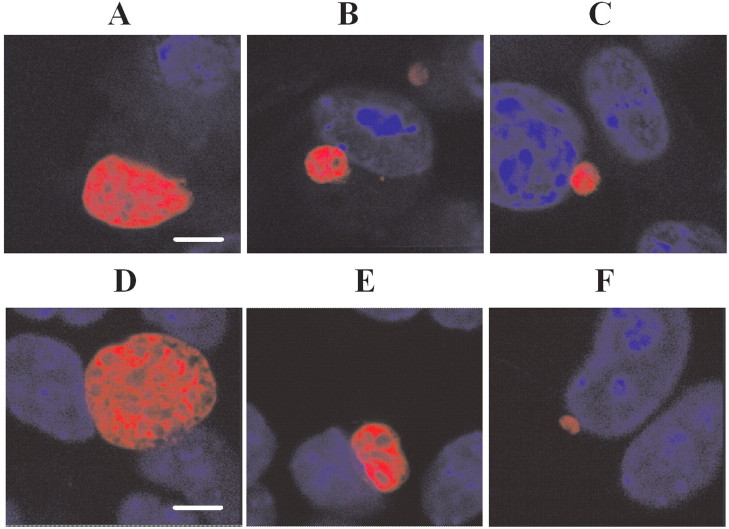
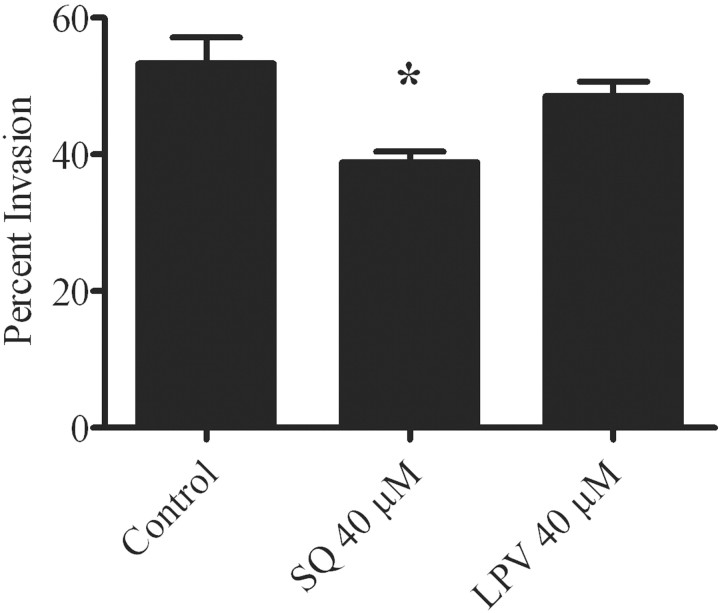
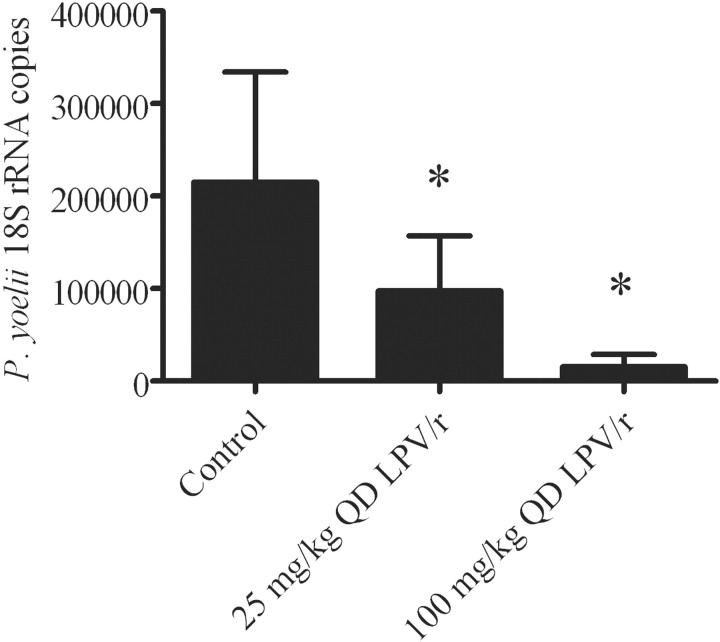
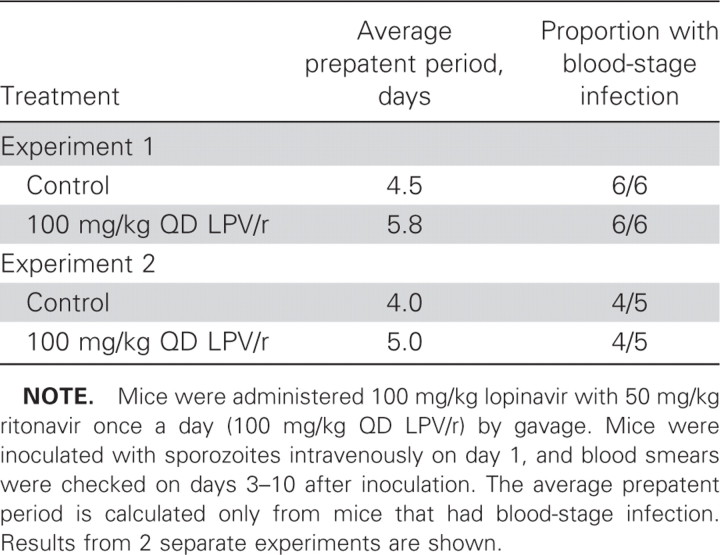
Recent studies have demonstrated that human immunodeficiency virus (HIV) protease inhibitors (PIs) exert inhibitory effects on erythrocytic stages of the human-malaria parasite Plasmodium falciparum in vitro and on erythrocytic stages of the rodent-malaria parasite Plasmodium chabaudi in vivo. Although it remains unclear how HIV PIs inhibit the parasite, the effect seen on parasite development in the erythrocytic stages is potent. The effect on preerythrocytic stages has not yet been investigated. Using the rodent parasite Plasmodium berghei, we screened a panel of HIV PIs in vitro for effects on the preerythrocytic stages. Our data indicated that the HIV PIs lopinavir and saquinavir affect preerythrocytic-stage parasite development in vitro. We then evaluated the effect of HIV PIs on preerythrocytic stages in vivo using the rodent parasite Plasmodium yoelii. We found that lopinavir/ritonavir had a dose-dependent effect on liver-stage parasite development. Given that sub-Saharan Africa is where the HIV/AIDS pandemic intersects with malaria, these results merit analysis in clinical settings.


Figures

Figure 1
Figure 1
Effect of saquinavir, lopinavir, atazanavir, amprenavir, and nelfinavir on the no. of developing exoerythrocytic forms (EEFs). Shown are the mean no. of EEFs per 20 high-powered fields (HPFs) (error bars show SEs), expressed as the percentage of control for the listed HIV protease inhibitors. Each bar represents data from 2 experiments, with each experiment run in triplicate wells. *P<.05 (statistically significant difference between the treated group and the control group).
Figure 2
Figure 2
Effect of saquinavir (SQ) (A) and lopinavir (LPV) (B) on the size of developing exoerythrocytic forms (EEFs). Drugs were added to sporozoite-infected hepatocytes immediately after a 1-h sporozoite invasion period (after which unattached sporozoites were washed away). Shown is the average size of EEFs at 46–48 h (diameters in assays fixed at 46 h are slightly smaller). Means were calculated from 5 randomly selected EEFs from each of 3 triplicate wells; shown are means ± SDs. Results are representative of 2 experiments. *P<.05 (statistically significant difference between the treated group and the control group).
Figure 3
Figure 3
Effect of saquinavir and lopinavir on exoerythrocytic form (EEF) morphology. Drugs were added to sporozoite-infected hepatocytes immediately after a 1-h sporozoite invasion period (after which unattached sporozoites were washed away); shown are confocal images of representative 46–48-h EEFs. A, Control with no drug. B, Saquinavir at 10 µmol/L. C, Saquinavir at 40 µmol/L. D, Control with no drug. E, Lopinavir at 10 µmol/L. F, Lopinavir at 40 µmol/L. Nuclear staining with 3,3'-diaminobenzidine (blue) shows the host cell nuclei. The bar indicates 6 microns. Diameters in assays fixed at 46 h are slightly smaller. Treatment at 40 µmol/L resulted in a reduction in EEF size by an average of 42% for saquinavir and 75% for lopinavir, compared with control.
Figure 4
Figure 4
Effect of saquinavir (SQ) and lopinavir (LPV) on Plasmodium berghei invasion. Sporozoites were preincubated with the indicated concentrations of drug and then added to hepatocytes in the continued presence of the drug for a 1-h period. Extracellular sporozoites and total sporozoites per field were counted in 50 fields per well, and the percent invasion was then calculated. *P<.05 (statistically significant difference between the treated group and the control group).
Figure 5
Figure 5
Effect of lopinavir/ritonavir on Plasmodium yoelii liver burden. Mice were gavaged with lopinavir/ritonavir before being injected intravenously with 10,000 P. yoelii sporozoites. Mice were given vehicle (control), 100 mg/kg lopinavir with 50 mg/kg ritonavir once a day (100 mg/kg QD LPV/r), or 25 mg/kg lopinavir with 12.5 mg/kg ritonavir once a day (25 mg/kg QD LPV/r), the lowest dose that had a significant effect. All experiments were performed twice, with 5–6 mice per group per experiment. *P<.05 (statistically significant difference between the treated group and the control group).
Table 1
Table 1
Prolongation of the prepatent period by lopinavir/ritonavir.

References

    1. Snow RW, Craig M, Deichmann U, Marsh K. Estimating mortality, morbidity and disability due to malaria among Africa's nonpregnant population. Bull World Health Organ. 1999;77:624–40. - PMC - PubMed
    1. World Health Organization, author. Malaria and HIV interactions and their implications for public health policy. [4 December 2007]. Available at: http://www.who.int/malaria/malaria_HIV/MalariaHIVinteractions_report.pdf.
    1. Korenromp EL, Williams BG, de Vlas SJ, et al. Malaria attributable to the HIV-1 epidemic, sub-Saharan Africa. Emerg Infect Dis. 2005;11:1410–9. - PMC - PubMed
    1. UNAIDS, author. Report on the global AIDS epidemic. [15 November 2007]. Available at: http://www.unaids.org/en/HIV_data/epi2006.
    1. Slutsker L, Marston BJ. HIV and malaria: interactions and implications. Curr Opin Infect Dis. 2007;20:3–10. - PubMed

Publication types