. 2008 Nov 25;10(1):54.
doi: 10.1186/1532-429X-10-54.

Cardiovascular magnetic resonance and prognosis in cardiac amyloidosis

Affiliations

Cardiovascular magnetic resonance and prognosis in cardiac amyloidosis

Alicia M Maceira et al. J Cardiovasc Magn Reson. .

Abstract

Background: Cardiac involvement is common in amyloidosis and associated with a variably adverse outcome. We have previously shown that cardiovascular magnetic resonance (CMR) can assess deposition of amyloid protein in the myocardial interstitium. In this study we assessed the prognostic value of late gadolinium enhancement (LGE) and gadolinium kinetics in cardiac amyloidosis in a prospective longitudinal study.

Materials and methods: The pre-defined study end point was all-cause mortality. We prospectively followed a cohort of 29 patients with proven cardiac amyloidosis. All patients underwent biopsy, 2D-echocardiography and Doppler studies, 123I-SAP scintigraphy, serum NT pro BNP assay, and CMR with a T1 mapping method and late gadolinium enhancement (LGE).

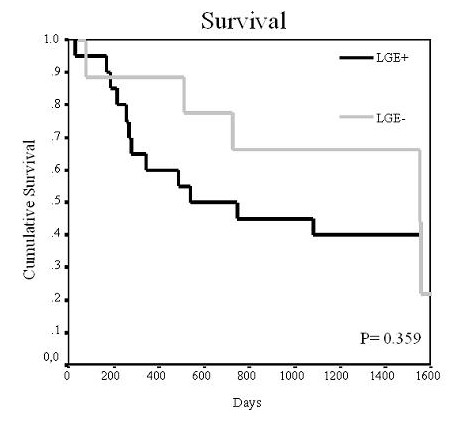
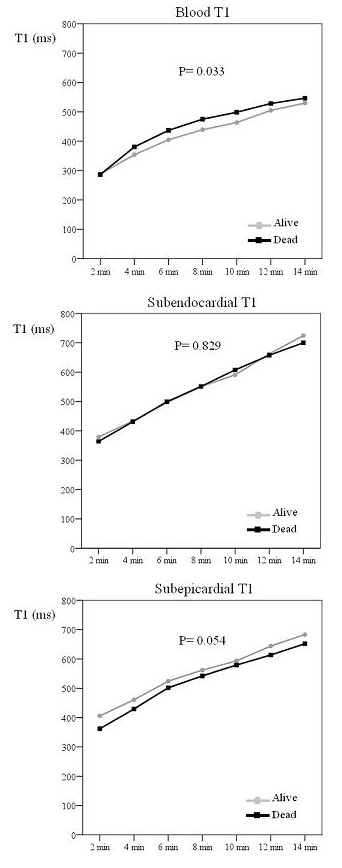
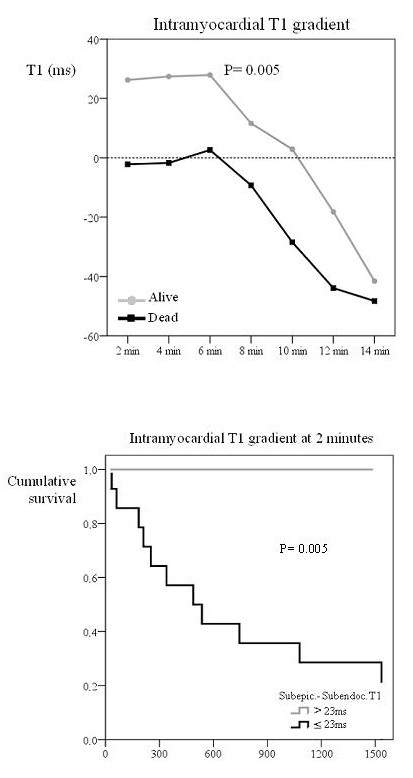
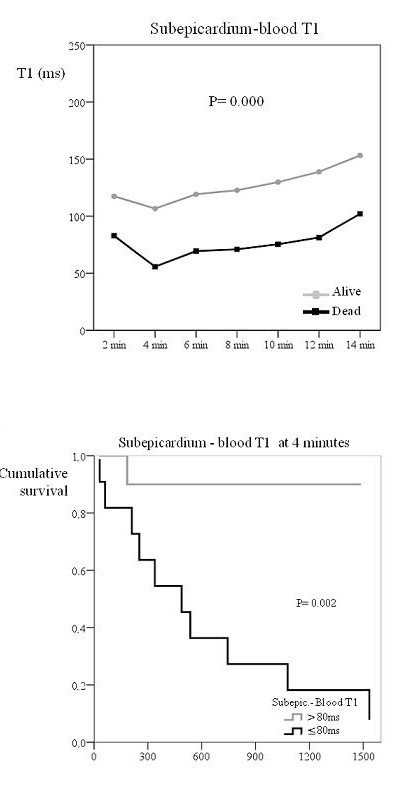
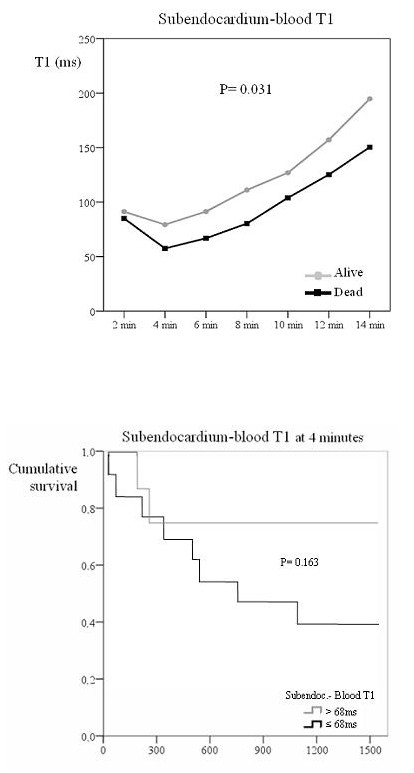
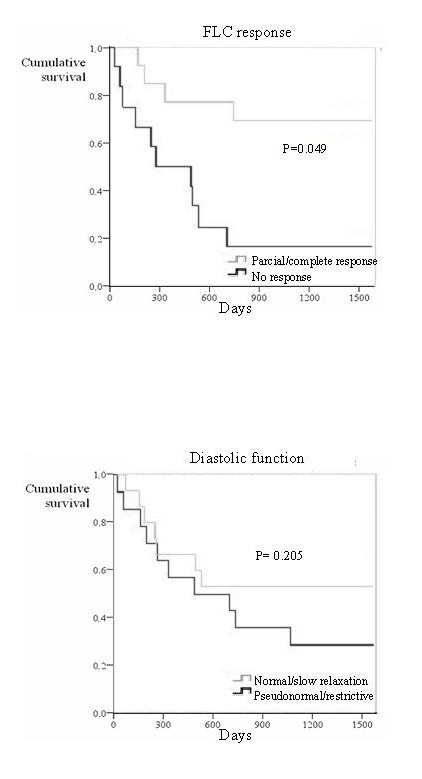
Results: Patients with were followed for a median of 623 days (IQ range 221, 1436), during which 17 (58%) patients died. The presence of myocardial LGE by itself was not a significant predictor of mortality. However, death was predicted by gadolinium kinetics, with the 2 minute post-gadolinium intramyocardial T1 difference between subepicardium and subendocardium predicting mortality with 85% accuracy at a threshold value of 23 ms (the lower the difference the worse the prognosis). Intramyocardial T1 gradient was a better predictor of survival than FLC response to chemotherapy (Kaplan Meier analysis P = 0.049) or diastolic function (Kaplan-Meier analysis P = 0.205).

Conclusion: In cardiac amyloidosis, CMR provides unique information relating to risk of mortality based on gadolinium kinetics which reflects the severity of the cardiac amyloid burden.


Figures

Figure 1
Figure 1
Survival curve according to late gadolinium enhancement (LGE). The figure shows the Kaplan Meier curve of survival according to the presence or absence of late gadolinium enhancement (LGE). No differences in survival were seen with respect to this parameter.
Figure 2
Figure 2
Differences in T1 after gadolinium injection between survivors and patients who died. The figure shows the differences in T1 of blood, subendocardium and subepicardium with time after gadolinium injection between survivors and patients who died on follow-up. Patients who died on follow up showed a higher blood T1 after gadolinium injection.
Figure 3
Figure 3
Top: Intramyocardial T1 difference in survivors and patients who died. Bottom: Survival curve according to intramyocardial T1 difference. The top graph shows the intramyocardial T1 difference (subepicardium – subendocardium) with time after gadolinium injection in survivors and patients who died. Survivors showed a significantly higher intramyocardial T1 difference after gadolinium injection. The bottom image shows the Kaplan Meier curve of survival according to intramyocardial T1 difference set a threshold value of 23 ms. Patients with an intramyocardial T1 difference above 23 ms had increased survival.
Figure 4
Figure 4
Top: Subepicardium to blood T1 difference in survivors and patients who died. Bottom: Survival curve according to this T1 difference. The top graph shows the subepicardium to blood T1 difference with time after gadolinium injection in survivors and patients who died. Survivors showed a significantly higher subepicardium to blood T1 difference after gadolinium injection. The bottom figure shows the Kaplan Meier curve of survival according to subepicardium to blood T1 difference set at a threshold value of 80 ms. Patients with a subepicardium to blood T1 difference above 80 ms had a better survival.
Figure 5
Figure 5
Top: Subendocardium to blood T1 difference in survivors and those who died. Bottom: Survival curve according to this T1 difference. The top graph shows the subendocardium to blood T1 difference with time after gadolinium injection in survivors and patients who died. Survivors showed a significantly higher subendocardium to blood T1 difference after gadolinium injection. The bottom figure shows the Kaplan Meier curve of survival according to subendocardium to blood T1 difference set a threshold value of 68 ms. No significant differences in survival were seen for this parameter.
Figure 6
Figure 6
Top: Survival curve according to FLC response. Bottom: Survival curve according to diastolic function. The top graph shows the Kaplan Meier curve of survival according to free light chain response to chemotherapy. Patients with partial/complete response had better survival. The bottom image shows the Kaplan Meier curve of survival according to diastolic function. The discrimination of survivors from non-survivors was superior for gadolinium kinetics (figure 3).

References

    1. Falk RH, Comenzo RL, Skinner M. The systemic amyloidoses. N Engl J Med. 1997;337:898–909. doi: 10.1056/NEJM199709253371306. - DOI - PubMed
    1. Kyle RA, Greipp PR, O'Fallon WM. Primary systemic amyloidosis: multivariate analysis for prognostic factors in 168 cases. Blood. 1986;68:220–4. - PubMed
    1. Arbustini E, Gavazzi A, Merlini G. Fibril-forming proteins: the amyloidosis: new hopes for a disease that cardiologists must know. Ital Heart J Suppl. 2002;3(6):590–597. - PubMed
    1. Nihoyannopoulos P. Amyloid heart disease. Current Opin Cardiol. 1987;2:371–6.
    1. Falk RH, Skinner M. The systemic amyloidoses: an overview. Adv Intern Med. 2000;45:107–137. - PubMed

MeSH terms