. 2008 Nov 25:9:31.
doi: 10.1186/1471-2091-9-31.

Lipid bilayer composition influences small multidrug transporters

Affiliations

Lipid bilayer composition influences small multidrug transporters

Kalypso Charalambous et al. BMC Biochem. .

Abstract

Background: Membrane proteins are influenced by their surrounding lipids. We investigate the effect of bilayer composition on the membrane transport activity of two members of the small multidrug resistance family; the Escherichia coli transporter, EmrE and the Mycobacterium tuberculosis, TBsmr. In particular we address the influence of phosphatidylethanolamine and anionic lipids on the activity of these multidrug transporters. Phosphatidylethanolamine lipids are native to the membranes of both transporters and also alter the lateral pressure profile of a lipid bilayer. Lipid bilayer lateral pressures affect membrane protein insertion, folding and activity and have been shown to influence reconstitution, topology and activity of membrane transport proteins.

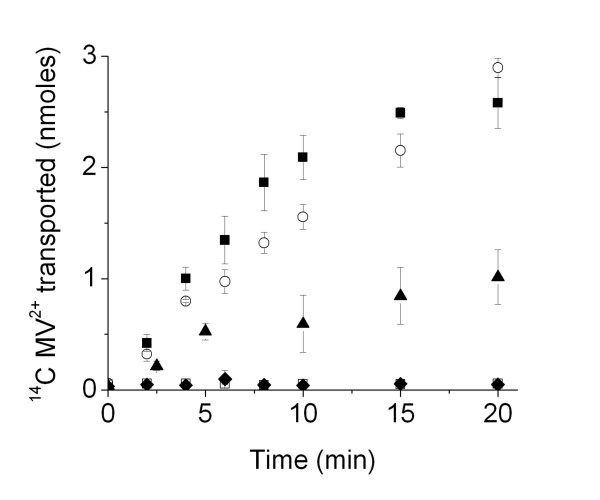
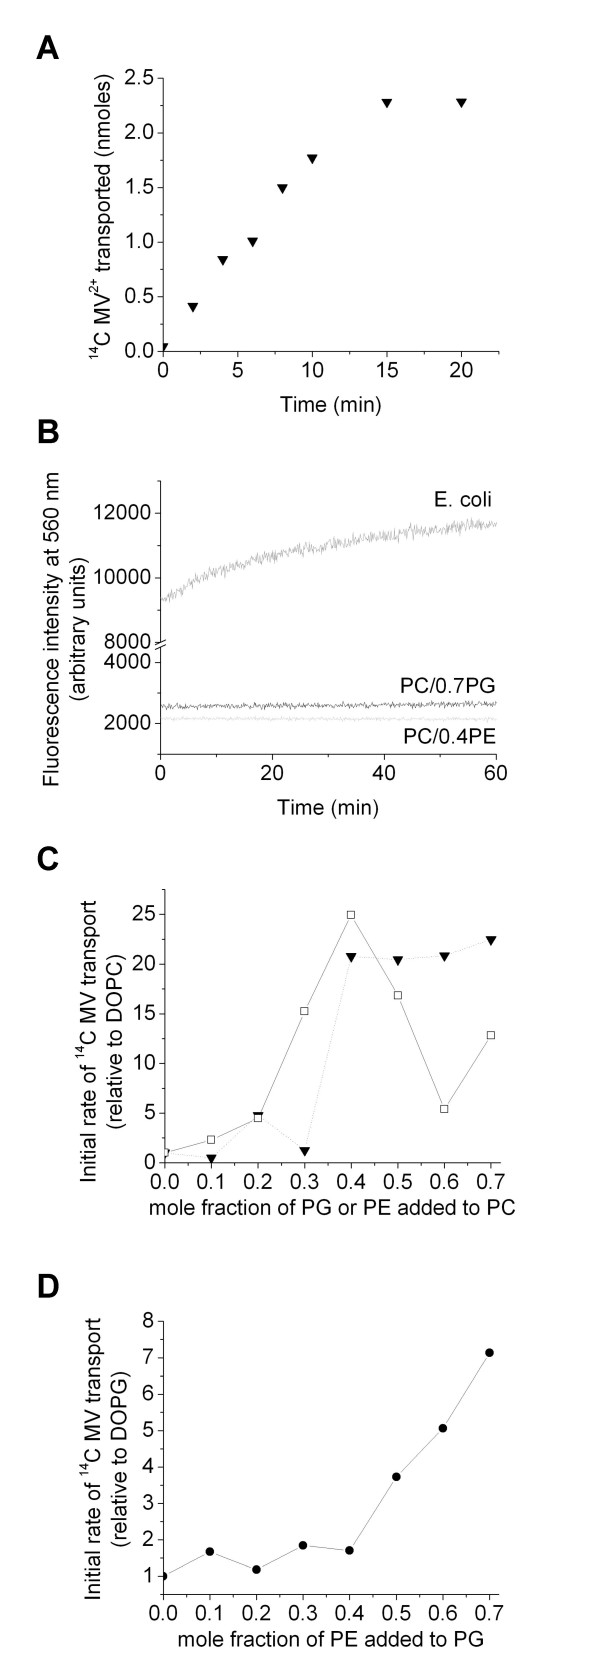
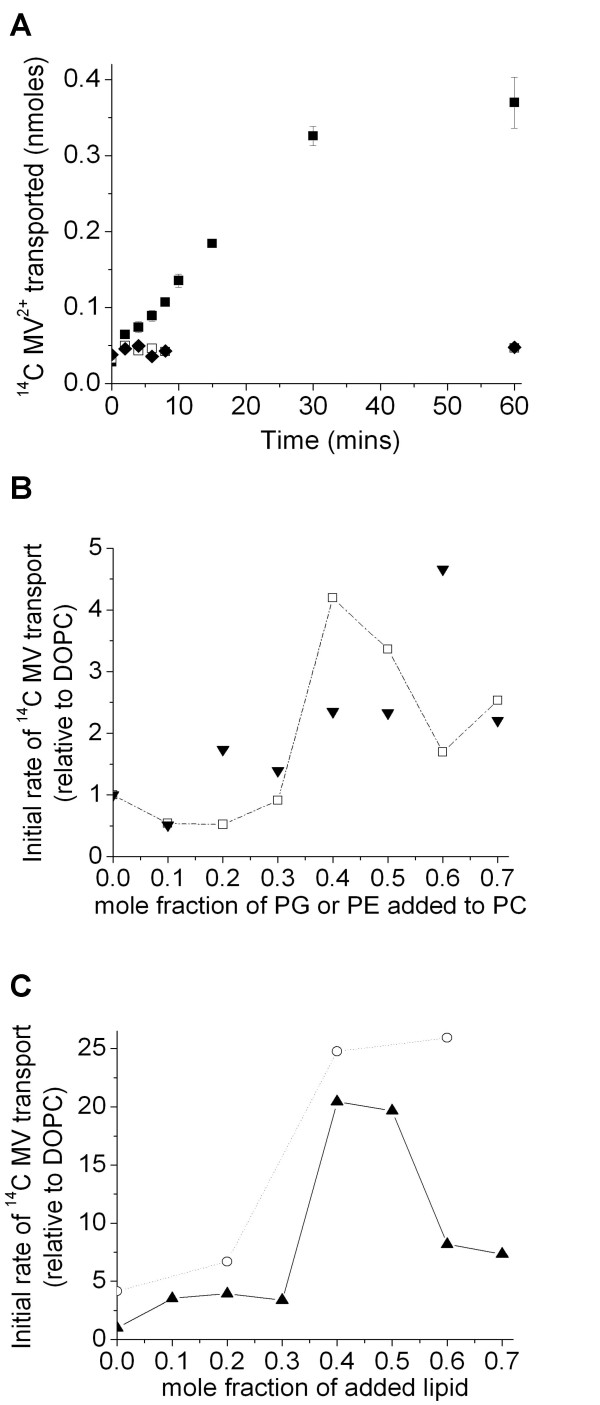
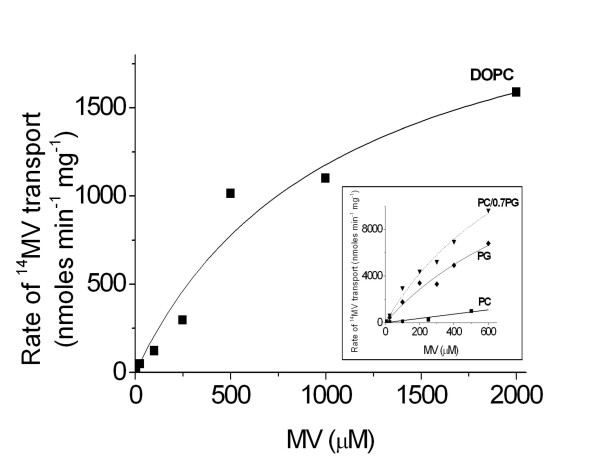
Results: Both EmrE and TBsmr are found to exhibit a similar dependence on lipid composition, with phosphatidylethanolamine increasing methyl viologen transport. Anionic lipids also increase transport for both EmrE and TBsmr, with the proteins showing a preference for their most prevalent native anionic lipid headgroup; phosphatidylglycerol for EmrE and phosphatidylinositol for TBsmr.

Conclusion: These findings show that the physical state of the membrane modifies drug transport and that substrate translocation is dependent on in vitro lipid composition. Multidrug transport activity seems to respond to alterations in the lateral forces exerted upon the transport proteins by the bilayer.


Figures

Figure 1
Figure 1
MV transport by EmrE. Radiolabelled, 14C MV2+ transport into E. coli lipid vesicles by EmrE over time. EmrE reconstituted into E. coli lipid vesicles extruded to (■), 50 nm; (○), 200 nm and (▲), sonicated lipid vesicles. Control data is shown for (□), absence of a pH gradient and (◆), absence of protein in 50 nm lipid vesicles. Errors are shown as first standard deviation of 3 measurements on different protein preparations (with each value used for each protein preparation, for each data point shown, also being the average of 3 measurements on that particular preparation).
Figure 2
Figure 2
(a) 14C MV2+transport by EmrE into vesicles of a defined mixture of lipids; DOPC/DOPG with 0.7 mole fraction DOPG. Data are raw transport data, not corrected for the amount of protein associated with the lipid vesicles. (b) Fluorescence intensity over time of the pH sensitive dye, carboxyfluorescein, incorporated inside lipid vesicles, illustrating the maintenance of the pH gradient over time in protein-containing vesicles of varying lipid composition: E. coli lipids (upper dark grey trace); DOPC/DOPG with 0.7 mole fraction DOPG (middle black trace) and DOPC/DOPE lipid vesicles with 0.4 mole fraction DOPE (lower light grey trace). The fluorescence intensities in the lower two traces only increase by ~5% over 60 mins, which is within the noise of the data. A ~30% increase in fluorescence intensity occurs in the upper E. coli trace over 60 mins (~9% over 10 mins). (c) Initial rate of 14C MV2+ transported by EmrE as a function of lipid composition in DOPC lipid vesicles. (□), DOPC/DOPE (▼), DOPC/DOPG. These initial rates are determined from the linear region of the MV transport data and additionally corrected for the amount of protein associated with the lipid vesicles. Thus, the point (▼) at 0.7 for DOPC/DOPG is determined from figure 2a. Data points are joined for clarification. (d) Initial rate of 14C MV2+ transported by EmrE as a function of DOPE mole fraction in DOPG/DOPE lipid vesicles. All assays were carried out with 42 μM 14C MV2+. Data in figures 2c and d are initial rate data, corrected for the amount of protein, thus are per mg of EmrE. For comparison, they are shown relative to the rate in DOPC lipid vesicles in (b) or the rate in DOPG in (c) (i.e. with the relative rate for DOPC or DOPG being 1). Data in (a) are the average of for triplicate measurements for one protein sample (see methods), with the errors being smaller than the data points. Data in b and c are determined by linear fits to the initial rate data, as for example in (a); the errors from these fits are also smaller than the data points.
Figure 3
Figure 3
MV transport by TBsmr. (a) 14C MV2+ transport into (■) 50 nm extruded E. coli lipid vesicles over time; control data with (□) no TBsmr present; (◆), no pH gradient. Initial rate of 14C MV transport as a function of lipid composition into (b) (□), DOPC/DOPE; (▼), DOPC/DOPG and (c) (▲) DOPC/soyPI; (○), soyPI/DOPE (the second lipid in each case is the mole fraction on the x axis). Data points are joined to clarify trends. Data in figures 3b and 3c are initial rate data, corrected for the amount of protein (thus are per mg of TBsmr) and shown relative to the rate in DOPC lipid vesicles. There is a larger pH gradient than for EmrE (pH 9 on the outside of the liposome for TBsmr, but pH 8 for EmrE and pH 7 inside for both proteins). As for EmrE, 42 μM 14C MV2+ was used in the TBsmr measurements.
Figure 4
Figure 4
Initial transport rate as a function of 14C MV2+ concentration in DOPC. Inset: data over 600 μM 14C MV2+ for transport in (■), DOPC; (◆) DOPG and (▼) DOPC/DOPG with 0.7 mole fraction DOPG. Curves represent fits of the data to the Michaelis Menten equation.

References

    1. Paulsen I, Skurray R, Tam R, Saier M, Turner R, Weiner J, Goldberg E, Grinius L. The SMR family: a novel family of multidrug efflux proteins involved with the efflux of lipophilic drugs. Mol Microbiol. 1996;19:1167–1175. doi: 10.1111/j.1365-2958.1996.tb02462.x. - DOI - PubMed
    1. Arkin I, Russ W, Lebendiker M, Schuldiner S. Determining the Secondary Structure and Orientation of EmrE, a Multi-Drug Transporter, Indicates a Transmembrane Four-Helix Bundle. Biochemistry. 1996;35:7233–7238. doi: 10.1021/bi960094i. - DOI - PubMed
    1. Tate CG, Kunji ERS, Lebendiker M, Schuldiner S. The projection structure of EmrE, a proton-linked multidrug transporter from Escherichia coli, at 7 angstroms resolution. EMBO J. 2001;20:77–81. doi: 10.1093/emboj/20.1.77. - DOI - PMC - PubMed
    1. Ubarretxena-Belandia I, Baldwin JM, Schuldiner S, Tate CG. Three-dimensional structure of the bacterial multidrug transporter EmrE shows it is an asymmetric homodimer. EMBO J. 2003;22:6175–6181. doi: 10.1093/emboj/cdg611. - DOI - PMC - PubMed
    1. Muth TR, Schuldiner S. A membrane-embedded glutamate is required for ligand binding to the multidrug transporter EmrE. EMBO J. 2000;19:234–240. doi: 10.1093/emboj/19.2.234. - DOI - PMC - PubMed

Publication types

MeSH terms

LinkOut - more resources