. 2009 Feb;165(2):64-77.
doi: 10.1016/j.jsb.2008.10.004. Epub 2008 Nov 8.

Tomographic subvolume alignment and subvolume classification applied to myosin V and SIV envelope spikes

Affiliations

Tomographic subvolume alignment and subvolume classification applied to myosin V and SIV envelope spikes

Hanspeter Winkler et al. J Struct Biol. 2009 Feb.

Abstract

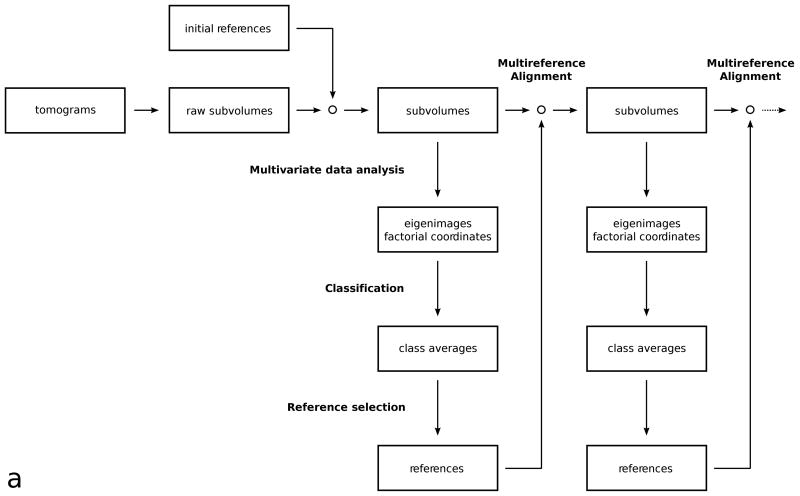
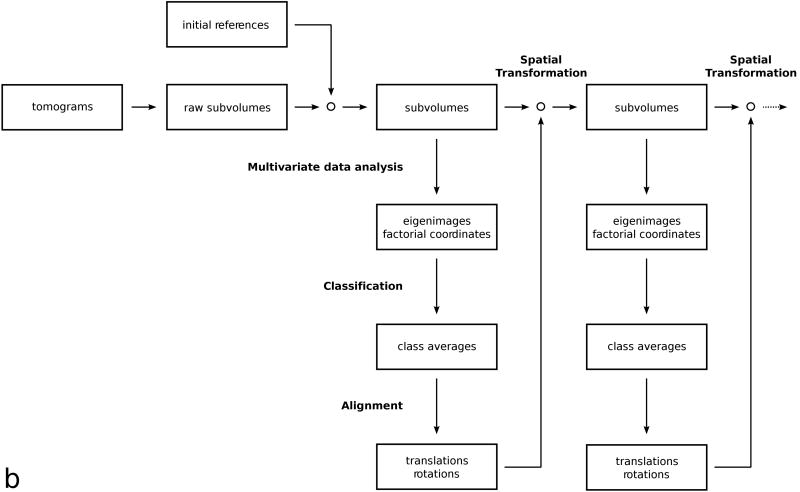
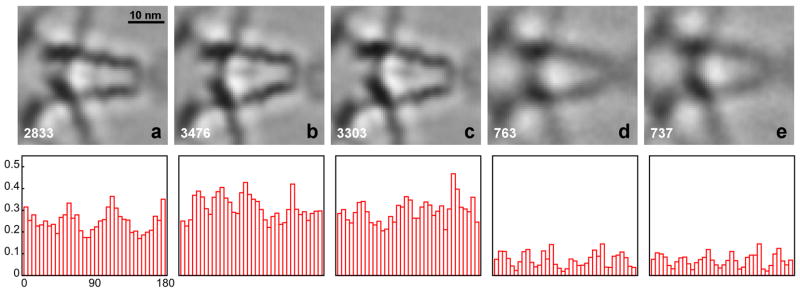
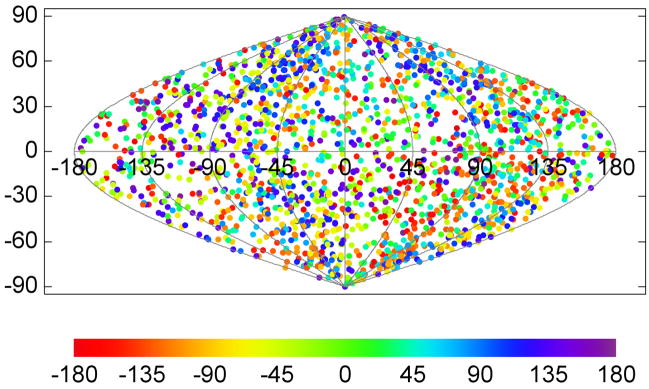
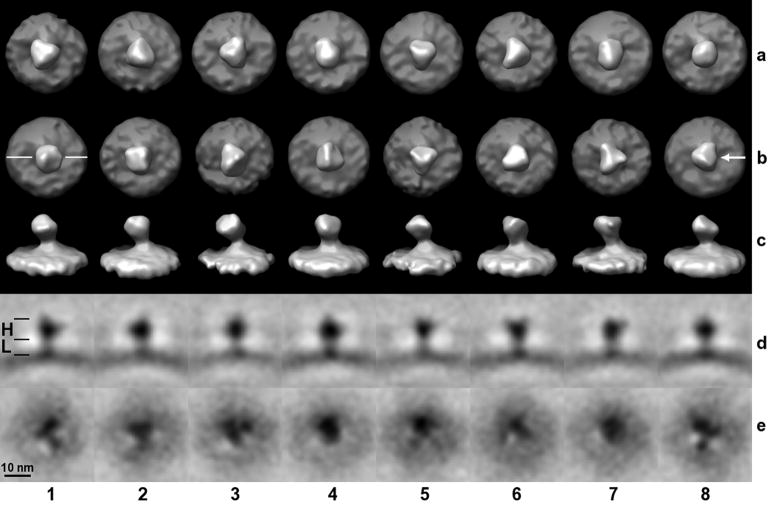
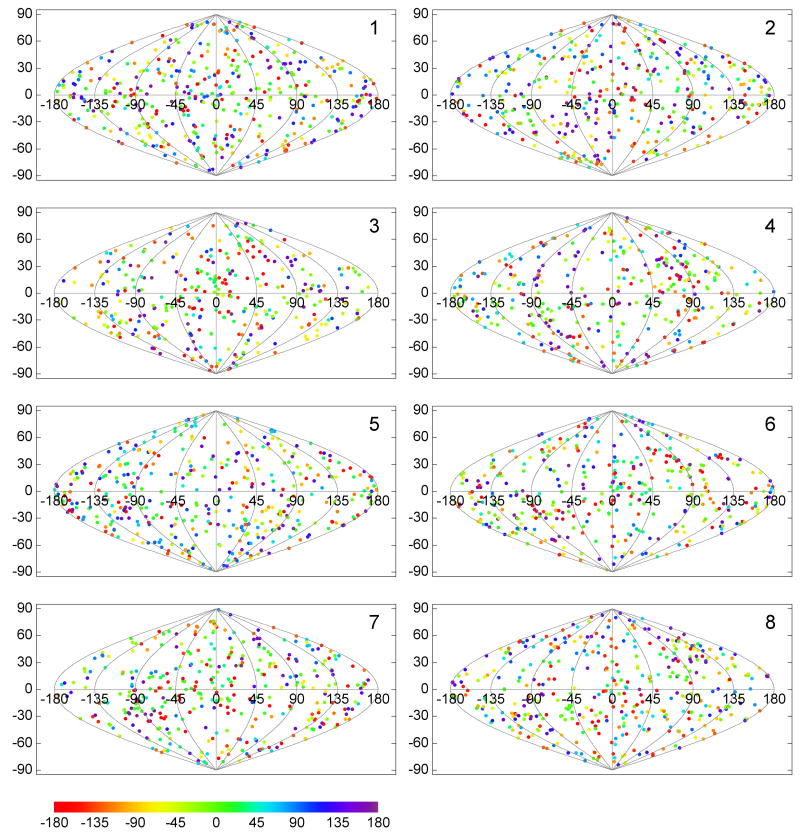
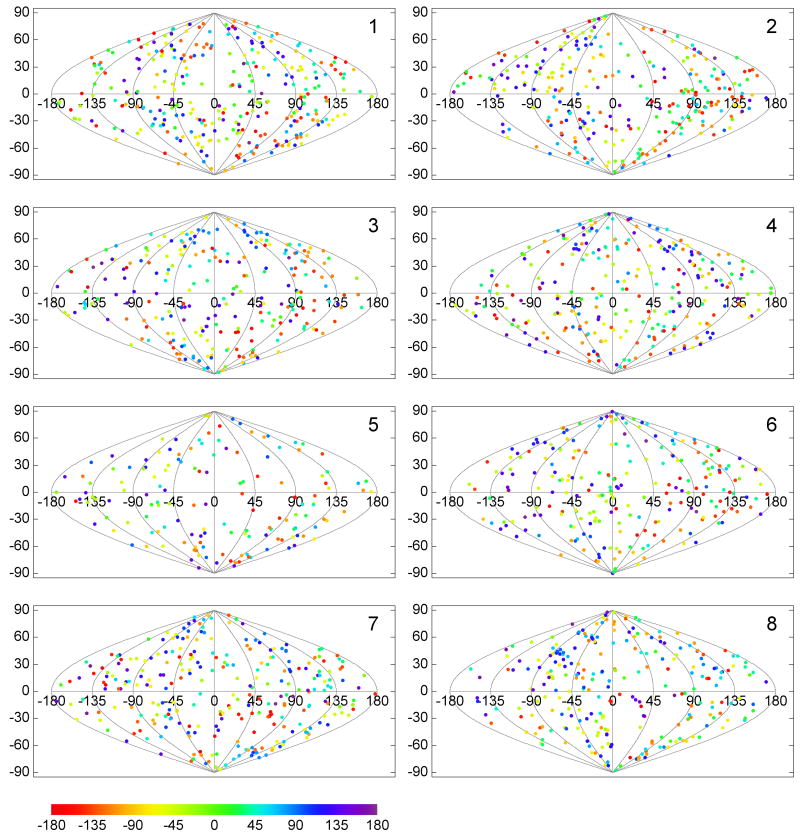
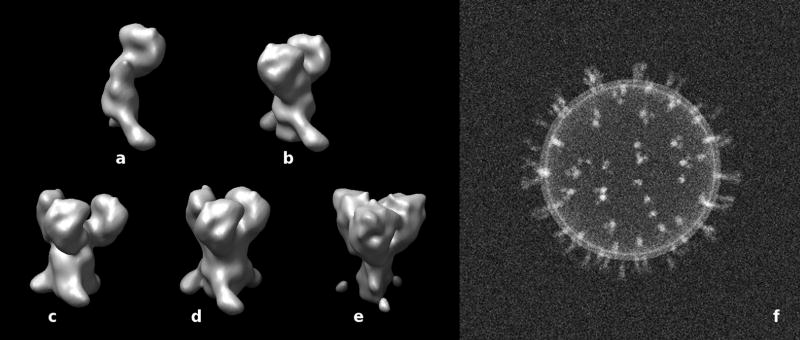
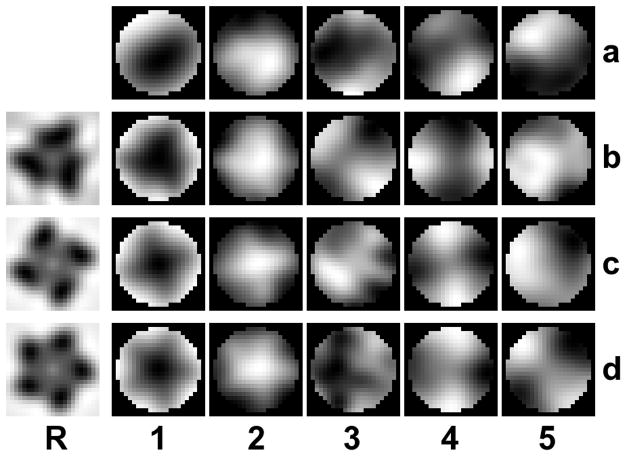
Electron tomography is a technique for three-dimensional reconstruction, that is widely used for imaging macromolecules, macromolecular assemblies or whole cells. Combined with cryo-electron microscopy, it is capable of visualizing structural detail in a state close to in vivo conditions in the cell. In electron tomography, micrographs are taken while tilting the specimen to different angles about a fixed axis. Due to mechanical constraints, the angular tilt range is limited. As a consequence, the reconstruction of a 3D image is missing data, which for a single axis tilt series is called the "missing wedge", a region in reciprocal space where Fourier coefficients cannot be obtained experimentally. Tomographic data is analyzed by extracting subvolumes from the raw tomograms, by alignment of the extracted subvolumes, multivariate data analysis, classification, and class-averaging, which results in an increased signal-to-noise ratio and substantial data reduction. Subvolume analysis is a valuable tool to discriminate heterogeneous populations of macromolecules, or conformations of a macromolecule or macromolecular assembly as well as to characterize interactions between macromolecules. However, this analysis is hampered by the lack of data in the original tomograms caused by the missing wedge. Here, we report enhancements of our subvolume processing protocols in which the problem of the missing data in reciprocal space is addressed by using constrained correlation and weighted averaging in reciprocal space. These procedures are applied to the analysis of myosin V and simian immunodeficiency virus (SIV) envelope spikes. We also investigate the effect of the missing wedge on image classification and establish limits of reliability by model calculations with generated phantoms.


Figures

Figure 1
Figure 1
(a) Flowchart of the multi-reference alignment and classification protocol. (b) Flowchart of the classification by alignment protocol.
Figure 1
Figure 1
(a) Flowchart of the multi-reference alignment and classification protocol. (b) Flowchart of the classification by alignment protocol.
Figure 2
Figure 2
(a) Section through a tomogram of myosin V in the inhibited state, adsorbed on a lipid monolayer, showing the para-crystalline, hexagonal arrangement of the “flower motifs” with one of the flower motifs highlighted. Inset: a petal of the flower motif with the molecular domains of myosin V highlighted. Red: motor domains, yellow: cargo-binding domain, blue: S2 domain, green: lever arms. (b) Histogram of the tilt axis directions (0° to 180°) in all aligned subvolumes with respect to the myosin V structure (“petals” within a flower motif). Note that not all orientations are equally represented, due to the para-crystalline arrangement.
Figure 3
Figure 3. Classification of myosin V petal motifs
The classification was carried out with the aligned subvolumes. The top row shows five classes (a–e), the number of subvolumes that contributed to the class averages is indicated at the bottom left of each average. The bottom row shows histograms of the tilt axis directions calculated with respect to the petal motif of the aligned subvolumes. Each histogram bin represents a fraction of the subvolumes in a particular angle range relative to the total number of subvolumes (Fig. 2b).
Figure 4
Figure 4. Classification of myosin V petal motifs
The classification was carried out with projections of the subvolumes instead of the subvolumes themselves. Refer to Fig. 3 for further details.
Figure 5
Figure 5. Spatial distribution of the tilt axis direction for the SIV specimen
The tilt axis direction is calculated with respect to the spike coordinate frame and mapped onto the surface of a unit sphere, which is then converted to a two-dimensional representation with a sinusoidal projection. Latitude 90° (vertical coordinate axis in the plot), for instance, corresponds to a tilt axis direction along the spike axis pointing to the spike head, −90° to the spike leg. Each plotted point indicates the tilt axis direction for a particular spike in the data set and the rotational orientation of the missing wedge relative to the tilt axis is color-coded. A property of the sinusoidal projection is that it preserves the area, so that the density of the plotted points is the same as on the spherical surface. The relatively uniform distribution indicates that the spikes were picked without favoring a particular orientation on the virion surface.
Figure 6
Figure 6. Classification of SIV spikes
Eight classes were generated (columns 1 – 8). Row (a): The mask used for the multivariate data analysis included the head and leg region of the spike, but not the slightly curved membrane. For rows (b, c, d), the mask included only the head region, for (e) only the leg region. Head (H) and leg (L) regions are marked with black lines in panel (1d). Rows (a, b) are surface rendered top views, (c) are the side views of (b) and the viewing direction with respect to the top view is indicated in panel (8b). In row (d), slices through the volumes of rows (b, c) are shown as gray-scale representations. The orientation of the slicing plane is indicated in panel (1b). Row (e) represent slices through the leg region perpendicular to the spike axis, i. e. slices are parallel to a tangential plane of the curved membrane.
Figure 7
Figure 7. Distribution of the tilt axis directions per class
The classes were produced by the multi-reference alignment scheme. Directions of the tilt axis for the same spikes as in Fig. 5 are plotted here separately for each of eight classes. The relatively uniform distribution in all directions of space for each of the classes indicates that the orientation of the missing wedge had no major effect on the classification, i. e. the subvolumes were not grouped according to the relative orientation of the tilt axis with respect to the spike.
Figure 8
Figure 8. Distribution of the tilt axis direction per class
The classes were produced by the alignment by classification scheme. For other details refer to Fig. 7.
Figure 9
Figure 9. Model calculations
(a–e) Surface renderings of density maps of artificially created spike structures. It should be noted that these spike structures are not intended to mimic actual spikes faithfully. (a) monomer, (b) dimer, (c, d, e) trimers with different density distributions in the head and leg region. In (c), the subunits in the head region are more widely spaced than in (d), i. e. an offset of 1 nm between the subunits has been applied. (e) was generated with a narrower and less dense leg region. (f) Projection of an assembled phantom using randomly selected maps (a–e) and a spherical vesicle-like structure generated with a lipid bilayer density profile.
Figure 10
Figure 10. Reference bias in a single reference alignment
Row (a) shows the first five eigenimages taken from a processing cycle of the SIV data set. An additional single reference alignment is carried out with the artificially created references in column (R) which have 3, 4, and 5-fold symmetry. The aligned subvolumes were then subjected to eigenvalue/eigenvector decomposition. The eigenimages of the data set after the single reference alignment are shown in rows (b – d). The first eigenimage (column 1) and to a lesser extent the second one (column 2) show clearly the symmetry of the reference, indicating an alignment bias towards the chosen reference. All panels represent sections through volumes perpendicular to the spike axis at a level in the head region of the spike.

References

    1. Bartesaghi A, Sprechmann P, Liu J, Randall G, Sapiro G, Subramaniam S. Classification and 3D averaging with missing wedge correction in biological electron tomography. J Struct Biol. 2008;162 (3):436–450. - PMC - PubMed
    1. Borland L, van Heel M. Classification of image data in conjugate representation spaces. J Opt Soc Am A. 1990;7:601–610.
    1. Dube P, Tavares P, Lurz R, van Heel M. The portal protein of bacteriophage SPP1: a DNA pump with 13-fold symmetry. EMBO J. 1993;12 (4):1303–1309. - PMC - PubMed
    1. Feller S, Venable R, Pastor R. Computer simulation of a DPPC phospho-lipid bilayer: Structural changes as a function of molecular surface area. Lang-muir. 1997;13 (24):6555–6561.
    1. Frangakis AS, Böhm J, Förster F, Nickell S, Nicastro D, Typke D, Hegerl R, Baumeister W. Identification of macromolecular complexes in cry-oelectron tomograms of phantom cells. Proc Natl Acad Sci USA. 2002;99 (22):14153–14158. - PMC - PubMed

Publication types

MeSH terms