. 2008 Dec 9;105(49):19538-43.
doi: 10.1073/pnas.0810232105. Epub 2008 Nov 25.

Complexin II plays a positive role in Ca2+-triggered exocytosis by facilitating vesicle priming

Affiliations

Complexin II plays a positive role in Ca2+-triggered exocytosis by facilitating vesicle priming

Haijiang Cai et al. Proc Natl Acad Sci U S A. .

Abstract

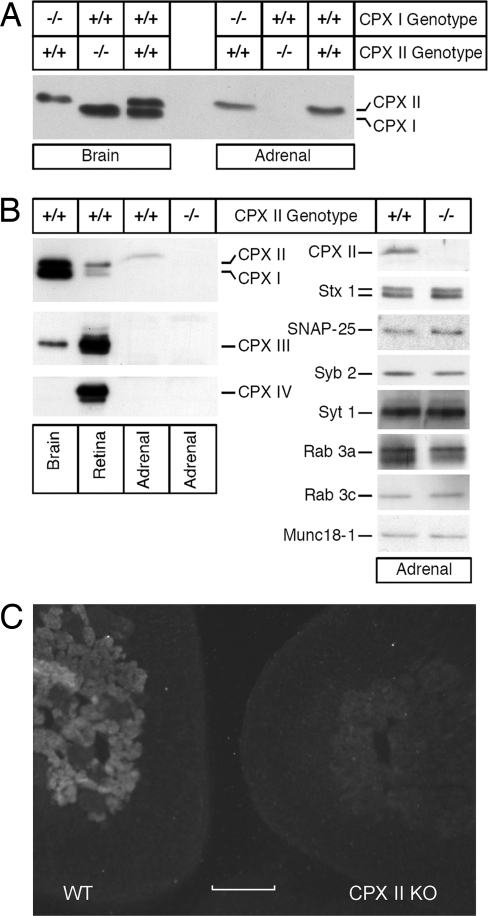
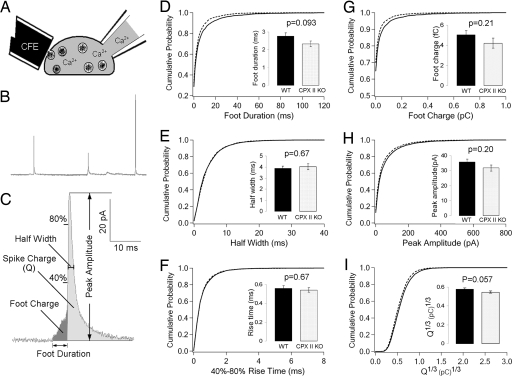
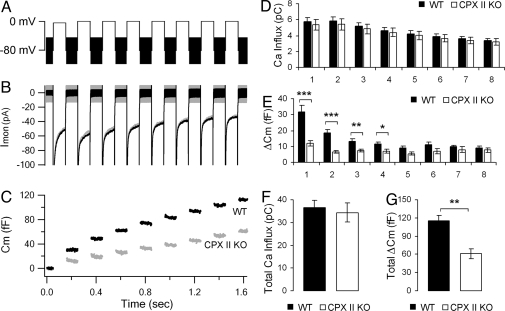
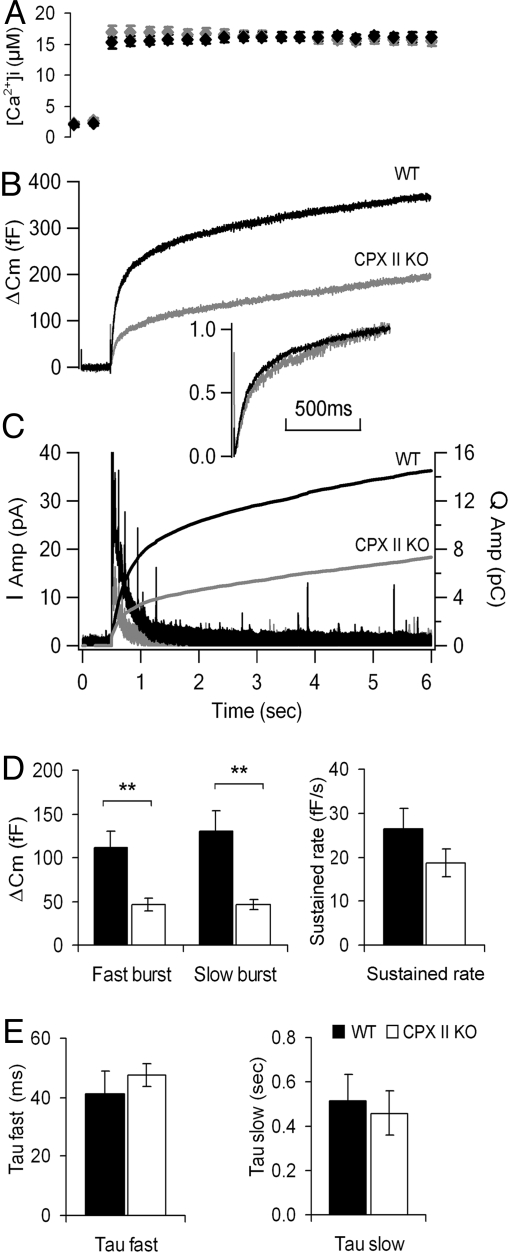
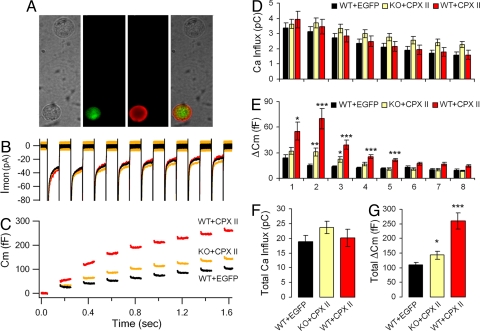
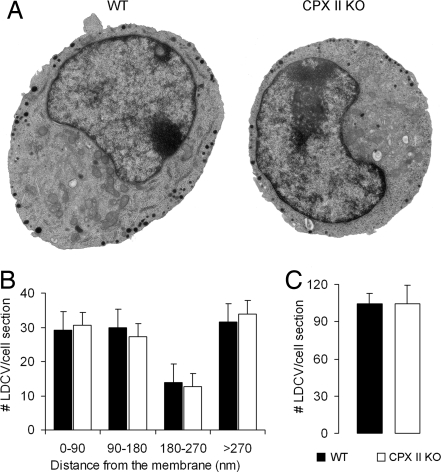
SNARE-mediated exocytosis is a multistage process central to synaptic transmission and hormone release. Complexins (CPXs) are small proteins that bind very rapidly and with a high affinity to the SNARE core complex, where they have been proposed recently to inhibit exocytosis by clamping the complex and inhibiting membrane fusion. However, several other studies also suggest that CPXs are positive regulators of neurotransmitter release. Thus, whether CPXs are positive or negative regulators of exocytosis is not known, much less the stage in the vesicle life cycle at which they function. Here, we systematically dissect the vesicle stages leading up to exocytosis using a knockout-rescue strategy in a mammalian model system. We show that adrenal chromaffin cells from CPX II knockout mice exhibit markedly diminished releasable vesicle pools (comprising the readily and slowly releasable pools), while showing no change in the kinetics of fusion pore dilation or morphological vesicle docking. Overexpression of WT CPX II-but not of SNARE-binding-deficient mutants-restores the size of the the releasable pools in knockout cells, and in WT cells it markedly enlarges them. Our results show that CPXs regulate the size of the primed vesicle pools and have a positive role in Ca(2+)-triggered exocytosis.


Conflict of interest statement

The authors declare no conflict of interest.

Figures

Fig. 1.
Fig. 1.
CPXs expression. (A) Western blot analyses of CPX I and CPX II expression levels in homogenates of brain (5 μg per lane) and adrenal gland (50 μg per lane) from mice of the indicated CPX I and CPX II genotypes. (B) (Left) Western blot analyses of CPX expression levels in homogenates of brain (5 μg per lane) and adrenal gland (50 μg per lane) from mice of the indicated CPX II genotypes. (Right) Western blot analyses of the expression levels of CPX II and selected presynaptic proteins in adrenal gland homogenates [50 μg per lane, except for SNAP-25 and Syntaxin 1 (10 μg per lane) and Synaptotagmin 1 (25 μg per lane)] from mice of the indicated CPX II genotypes. Analyses were conducted on 3 mice for each of the indicated CPX II genotypes, and the blots shown are representative. CPX, Complexin; Stx 1, Syntaxin 1; Syb 2, Synaptobrevin 2; Syt 1, Synaptotagmin 1. (C) Immuno-histochemical staining of cryostat sections from WT (Left) and CPX II−/− (Right) mice with antibodies against CPX I/II. Only the medulla chromaffin cells from the WT animals show bright CPX labeling. (Scale bar: 100 μm.)
Fig. 2.
Fig. 2.
Characteristics of single amperometric events. (A) Experimental configuration of whole-cell patch clamp combined with amperometry, carbon fiber electrode (CFE). (B) Sample amperometry recording. The introduction of Ca2+ at 10 μM via the pipette triggers exocytotic events at such a frequency that the individual amperometric spikes, representing single-vesicle exocytosis, are well-separated. (C) Characteristics of a single amperometric event. (D–I) Cumulative distribution of single amperometric event characteristics. (Insets) Bar graphs show the mean ± SEM of corresponding parameters. A total of 49 WT cells (n = 49) from 6 animals (solid lines, WT) and 53 CPX II−/− cells (n = 53) from 6 animals (dashed lines, CPX II KO) were analyzed. Spikes (12–100) were recorded from each cell.
Fig. 3.
Fig. 3.
Secretion triggered by trains of depolarizations. (A) Voltage protocol with eight 100-ms depolarizations. (B and C) Averaged ionic currents (B) and membrane capacitance response (C) from CPX II−/− (gray) and WT (black) cells. Cm before stimulus was subtracted. (D–G) Ca2+ influxes and ΔCm for each of the individual 8 depolarizations (D and E) and summed over all 8 depolarizations (F and G). Data were averaged from 26 experiments from 15 WT cells, 3 animals (n = 26, black), and from 20 experiments from 15 CPX II−/− cells, 3 animals (n = 20, white). Data are expressed as mean ± SEM. *, P < 0.01; **, P < 0.005; ***, P < 0.00005.
Fig. 4.
Fig. 4.
Exocytosis triggered by photolyzing caged Ca2+. (A–C) Averaged [Ca2+]i (A), averaged secretion as monitored with membrane capacitance measurements (B)m or with amperometry (C) from CPX II−/− (gray) and WT (black) cells. (Inset) Cm traces were scaled to the same amplitude at 1 s after flash to compare the kinetics of Cm increases. The amperometric traces were also integrated to show the cumulative secretion (C). (D) Analysis of the size of burst phases and sustained rate of secretion by capacitance measurements. Data were averaged from 13 experiments on 11 WT cells, 4 animals (black, n = 13), and from 16 experiments on 11 CPX II−/− cells, 5 animals (white, n = 16). **, P < 0.007. (E) Analysis of the time constants of the fast and slow bursts of secretion (WT, black, n = 13; CPX II KO, white, n = 14). Data are shown as mean ± SEM.
Fig. 5.
Fig. 5.
Secretion of cells transduced with Semliki Forest Virus. (A) Immunostaining of CPX II−/− cells rescued by virus-mediated expression of CPX II. The cell (Lower) that expresses EGFP (green) can also be labeled by anti-CPX II antibody (red), whereas the cell (Upper) that does not express EGFP shows no CPX II labeling. (B and C) Averaged ionic current recordings (B) and capacitance response (C). Cm before stimulus was subtracted. (D–G) Ca2+ influxes and ΔCm for each individual depolarization (D and E) and summed over all depolarizations (F and G). Data from WT cells expressing EGFP are in black (WT+EGFP, 38 experiments from 27 cells, 7 animals, n = 38), CPX II−/− cells expressing CPX II and EGFP are in orange (KO+CPX II, 27 experiments from 17 cells, 4 animals, n = 27), from WT cells overexpressing CPX II and EGFP are in red (WT+CPX II, 14 experiments from 9 cells, 3 animals, n = 27). Data are shown as mean ± SEM. *, P < 0.05; **, P < 0.005; ***, P < 0.0005.
Fig. 6.
Fig. 6.
Ultrastructure of WT and CPX II−/− chromaffin cells. (A) Electron micrographs of cultured mouse adrenal chromaffin cells. (Left) WT cell. (Right) CPX II−/− cell. (B) Analysis of the cellular distribution of large dense core vesicles (LDCVs). The distributions were calculated based on the distance from the center of the vesicle to the plasma membrane. The numbers of LDCVs per section in the depicted distance ranges are expressed as mean± SEM. (C) Total number of LDCVs per cell section (mean ± SEM). Data were averaged from 10 WT cells (black, WT), and 13 CPX II−/− cells (white, CPX II KO).

References

    1. Jahn R, Scheller RH. SNAREs—engines for membrane fusion. Nat Rev Mol Cell Biol. 2006;7:631–643. - PubMed
    1. Jahn R, Sudhof TC. Membrane fusion and exocytosis. Annu Rev Biochem. 1999;68:863–911. - PubMed
    1. Chen YA, Scheller RH. SNARE-mediated membrane fusion. Nat Rev Mol Cell Biol. 2001;2:98–106. - PubMed
    1. Rothman JE. Mechanisms of intracellular protein transport. Nature. 1994;372:55–63. - PubMed
    1. Weber T, et al. SNAREpins: Minimal machinery for membrane fusion. Cell. 1998;92:759–772. - PubMed

Publication types

MeSH terms

LinkOut - more resources