. 2008 Nov 25;105(47):18145-52.
doi: 10.1073/pnas.0807005105.

Stepwise evolution of protein native structure with electrospray into the gas phase, 10(-12) to 10(2) s

Affiliations

Stepwise evolution of protein native structure with electrospray into the gas phase, 10(-12) to 10(2) s

Kathrin Breuker et al. Proc Natl Acad Sci U S A. .

Abstract

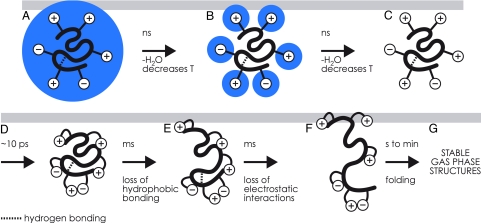
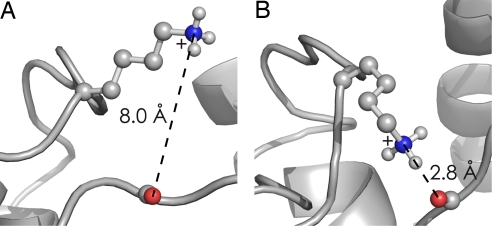
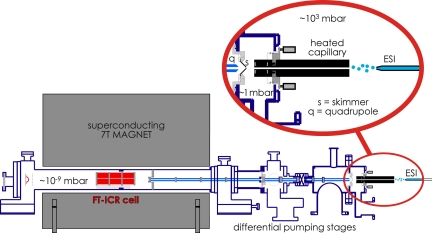
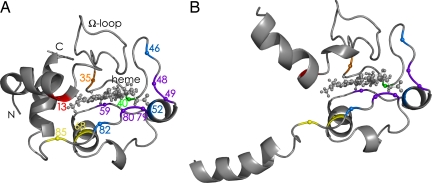
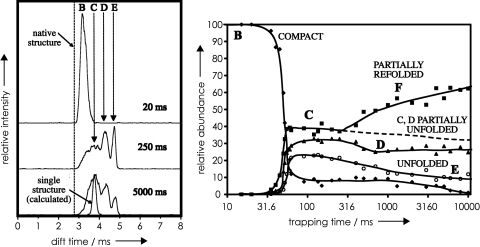
Mass spectrometry (MS) has been revolutionized by electrospray ionization (ESI), which is sufficiently "gentle" to introduce nonvolatile biomolecules such as proteins and nucleic acids (RNA or DNA) into the gas phase without breaking covalent bonds. Although in some cases noncovalent bonding can be maintained sufficiently for ESI/MS characterization of the solution structure of large protein complexes and native enzyme/substrate binding, the new gaseous environment can ultimately cause dramatic structural alterations. The temporal (picoseconds to minutes) evolution of native protein structure during and after transfer into the gas phase, as proposed here based on a variety of studies, can involve side-chain collapse, unfolding, and refolding into new, non-native structures. Control of individual experimental factors allows optimization for specific research objectives.


Conflict of interest statement

The authors declare no conflict of interest.

Figures

Fig. 1.
Fig. 1.
Stepwise evolution after ESI of the structure of a globular protein (e.g., cytochrome c, ubiquitin). (A) Native protein covered with a monolayer of H2O, followed by nanosecond H2O loss and concomitant cooling. (B) Native protein with exterior ionic functionalities still hydrated undergoes ns H2O loss and cooling. (C) The dry protein undergoes ≈10-ps collapse of its exterior ionic functionalities. (D–G) The exterior-collapsed “near-native” protein undergoes thermal re-equilibration (D), millisecond loss of hydrophobic bonding (E), and millisecond loss of electrostatic interactions (F); the transiently unfolded ions form new noncovalent bonds in seconds, folding to more stable gaseous ion structures (G); these stabilize to energy minima conformers in minutes.
Fig. 2.
Fig. 2.
In ESI of native cytochrome c, juxtaposition of the ε-N+H3 of Lys-79 versus the amide oxygen of Tyr-48. (A) Local native structure just after complete H2O loss. (B) Ten picoseconds later, the near-instantaneous collapse forming ionic hydrogen bonds between these adjacent (in structure, but not sequence) sites. [Reproduced with permission from ref. (Copyright 2008, Wiley).]
Fig. 3.
Fig. 3.
Electrospray of a protein solution (from right) at atmospheric pressure with ≈1-kV acceleration of ESI droplets into a heated capillary. Exiting ions are accelerated (≈50 V) into a lower pressure (≈1 mbar) region to undergo variable low energy (<1 eV) collisions, pass through a skimmer into a lower pressure region for possible higher energy (>1 eV) collisions, and are conducted into and trapped inside the measurement cell (≈10−9 mbar) of the Fourier-transform mass spectrometer.
Fig. 4.
Fig. 4.
Cytochrome c structures. (A) Native state, based on NMR data (31). (B) Initial gas-phase unfolding, based on NECD data (27). The order of regional stability in the gas phase, based on the reverse of the order of unfolding determined in NECD experiments, is Y48/T49 = W59 = K79/M80 > F46 = N52 = F82 > T40 > L68 = I85 > L35 > K13.
Fig. 5.
Fig. 5.
Ion mobility drift times of 9+ cytochrome c ions stored after ESI at 27°C and 1.3 mbar for various trapping times. Drift times are the smallest for the most compact ions and are directly related to ion collision cross sections. (Left) Drift times characterizing compact conformer B, partially unfolded conformers C and D, and unfolded conformer E. (Right) Relative conformer abundance as a function of trapping time. [Reproduced with permission from ref. (Copyright 2005, Elsevier).]
Fig. 6.
Fig. 6.
Relative log intensity values of ECD products from cleavage next to indicated residues of ubiquitin 7+ ions versus time after unfolding by an IR laser pulse (from ref. 21). Apparent first-order rate constants for initial refolding that prevents ECD product separation at the indicated residues are shown in the box. Note that overall refolding can be both single-step and two-step, even folding and unfolding, not necessarily returning to the same degree of folding as before unfolding with the IR laser, and with a temperature increase changing the folding process from one-step to two-step. [Reproduced with permission from ref. (Copyright 2002, American Chemical Society).]
Fig. 7.
Fig. 7.
Unique collision cross-section values of ubiquitin ions of various charge states, indicating multiple gaseous conformers, from the references indicated. [Reproduced with permission from ref. (Copyright 2006, Wiley).]

References

    1. Karas M, Bachmann D, Bahr U, Hillenkamp F. Matrix-assisted ultraviolet laser desorption of nonvolatile compounds. Int J Mass Spectrom. 1987;78:53–68.
    1. Fenn JB, Mann M, Meng CK, Wong SF, Whitehouse CM. Electrospray ionization for mass spectrometry of large biomolecules. Science. 1989;246:64–71. - PubMed
    1. Ganem B, Li Y-T, Henion JD. Detection of noncovalent receptor–ligand complexes by mass spectrometry. J Am Chem Soc. 1991;113:6294–6296.
    1. Ganem B, Li Y-T, Henion JD. Observation of noncovalent enzyme–substrate and enzyme–product complexes by ion spray mass spectrometry. J Am Chem Soc. 1991;113:7818–7819.
    1. Katta V, Chait BT. Observation of the heme–globin complex in native myoglobin by electrospray ionization mass spectrometry. J Am Chem Soc. 1991;113:8534–8535.

Publication types

LinkOut - more resources