. 2009;60(1):237-48.
doi: 10.1093/jxb/ern281. Epub 2008 Nov 25.

Identification of growth processes involved in QTLs for tomato fruit size and composition

Affiliations

Identification of growth processes involved in QTLs for tomato fruit size and composition

Nadia Bertin et al. J Exp Bot. 2009.

Abstract

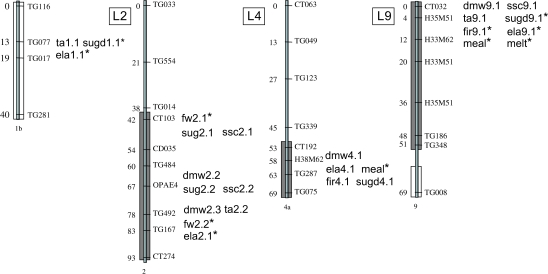
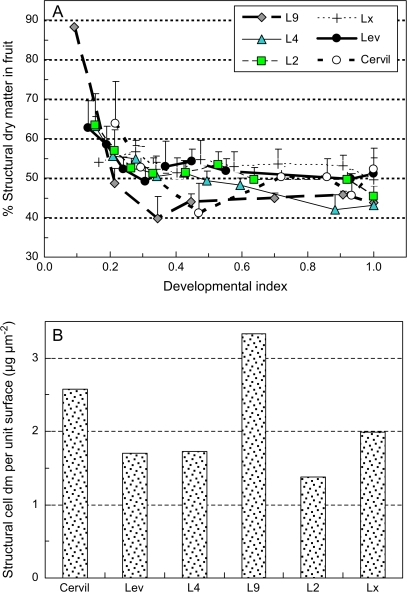
Many quantitative trait loci (QTLs) for quality traits have been located on the tomato genetic map, but introgression of favourable wild alleles into large fruited species is hampered by co-localizations of QTLs with antagonist effects. The aim of this study was to assess the growth processes controlled by the main QTLs for fruit size and composition. Four nearly isogenic lines (NILs) derived from an intraspecific cross between a tasty cherry tomato (Cervil) and a normal-tasting large fruit tomato (Levovil) were studied. The lines carried one (L2, L4, and L9) or five (Lx) introgressions from Cervil on chromosomes 1, 2, 4, and 9. QTLs for fruit size could be mainly associated with cell division processes in L2 and L9, whereas cell expansion was rather homogeneous among the genotypes, except Cervil for which the low expansion rate was attributed to low cell plasticity. The link between endoreduplication and fruit size remained unclear, as cell or fruit sizes were positively correlated with the cell DNA content, but not with the endoreduplication factor. QTLs for fruit composition reflected differences in water accumulation rather than in sugar accumulation, except in L9 for which the up-regulation of sucrose unloading and hexose transport and/or starch synthesis was suggested. This may explain the increased amount of carbon allocated to cell structures in L9, which could be related to a QTL for fruit texture. In Lx, these effects were attenuated, except on fruit size and cell division. Finally, the region on top of chromosome 9 may control size and composition attributes in tomato, by a combination of QTL effects on cell division, cell wall synthesis, and carbon import and metabolism.


Figures

Fig. 1.
Fig. 1.
Molecular map showing regions of interest on chromosomes 1, 2, 4, and 9, carrying the QTL for organoleptic quality, based on an intraspecific RIL population derived from a cross between a cherry tomato line and a large fruit line. Distances in Kosambi centiMorgans are on the left of chromosomes, and marker names are on the right. The introgressed regions in Lx are indicated by white rectangles and the regions introgressed in L2, L4, and L9 are in grey. On the right of chromosomes, QTLs are mentioned for fruit weight (fw), titratable acidity (ta), dry matter content (dmw), soluble solid content (ssc), sugar content (sug) relative to fresh weight, firmness (fir), elasticity (ela), mealiness (meal), and meltiness (melt) as described in Saliba-Colombani et al. (2001), and for sugar contents relative to dry weight (sugd, unpublished data). Asterisks indicate that the Levovil allele provided higher value to the trait. (This figure is available in colour at JXB online.)
Fig. 2.
Fig. 2.
(A) Fruit fresh weight increase during fruit ageing. Curves were fitted with three-parameter Gompertz functions (R2 > 0.92). For each genotype (Lev, solid bold line; L4, solid thin line; L9, large dotted bold line; L2, large dotted thin line; Lx, small dotted thin line; Cervil, small dotted bold line) 150–300 individual fruits were sampled between anthesis and red mature stage at 5 d intervals. Each point is the mean of >20 fruits, and vertical bars show 95% CIs when larger than symbols. (B) Growth rates were deduced from the derivative curves. (This figure is available in colour at JXB online.)
Fig. 3.
Fig. 3.
Dynamics of (A) pericarp cell number and (B) volume of one mean cell during fruit ageing. Each point is the mean of 8–10 fruits, and vertical bars show 95% CIs when larger than symbols. Basal and tip fruits were pooled which explains data scattering, in particular for the large fruit genotypes. Cell number data were fitted by a three-parameter logistic function (R2 >0.80) and cell volume data were fitted by a three-parameter Gompertz function (R2 >0.96) (Lev, solid bold line; L4, solid thin line; L9, large dotted bold line; L2, large dotted thin line; Lx, small dotted thin line; Cervil, small dotted bold line). Lettering indicates statistically homogenous groups at maturity (P <0.05). (C) Relationships at maturity between fruit fresh weight and cell number. Each point represents an individual fruit. (This figure is available in colour at JXB online.)
Fig. 4.
Fig. 4.
(A) Endoreduplication factor measured during fruit development. Each point is the mean of 7–15 fruits, and vertical bars are 95% CIs. (B) Dynamics of cell DNA content estimated from the C level of an average cell measured during fruit development and considering that 1C is equivalent to 950 pg of DNA [Eqn (3)]. (C) Relationships between final cell size and final cell DNA content for the two parental lines and four QTL-NILs. (This figure is available in colour at JXB online.)
Fig. 5.
Fig. 5.
Dynamics of the fruit osmotic pressure (calculated according to Nobel, 1974) due to soluble sugar and organic acid accumulation in each genotype (Lev, solid bold line; L4, solid thin line; L9, large dotted bold line; L2, large dotted thin line; Lx, small dotted thin line; Cervil, small dotted bold line). Each point is the mean of 10–15 fruits, and vertical bars are 95% CIs. Lettering indicates statistically homogenous groups at maturity (P <0.05). (This figure is available in colour at JXB online.)
Fig. 6.
Fig. 6.
Dynamics of (A) total carbohydrate, (B) starch, (C) soluble sugars, (D) citric acid, and (E) malic acid contents on a dry matter basis, during fruit development of each genotype (Lev, solid bold line; L4, solid thin line; L9, large dotted bold line; L2, large dotted thin line; Lx, small dotted thin line; Cervil, small dotted bold line). Each point is the mean of 10–15 fruits, and vertical bars are 95% CIs. Lettering indicates statistically homogenous groups at maturity (P <0.05) when the ANOVA outlined a significant genotype effect. (This figure is available in colour at JXB online.)
Figure 7.
Figure 7.
(A) Dynamics of the percentage of structural dry matter estimated during fruit development. Each point is the mean of 10–15 fruits, and vertical bars are 95% CIs. (B) Estimation of structural dry weight per cell surface at maturity for the different genotypes. (This figure is available in colour at JXB online.)

References

    1. Arumuganathan K, Earle E. Estimation of nuclear DNA content of plants by flow cytometry. Plant Molecular Biology Reports. 1991;9:208–218.
    1. Bai Y, Lindhout P. Domestication and breeding of tomatoes: what have we gained and what can we gain in the future? Annals of Botany. 2007;100:1085–1094. - PMC - PubMed
    1. Bertin N. Analysis of the tomato fruit growth response to temperature and plant fruit load in relation to cell division, cell expansion and DNA endoreduplication. Annals of Botany. 2005;95:439–447. - PMC - PubMed
    1. Bertin N, Borel C, Brunel B, Cheniclet C, Causse M. Do genetic makeup and growth manipulation affect tomato fruit size by cell number, or cell size and DNA endoreduplication? Annals of Botany. 2003;92:415–424. - PMC - PubMed
    1. Bertin N, Gautier H, Roche C. Number of cells in tomato fruit depending on fruit position and source–sink balance during plant development. Plant Growth Regulation. 2002;36:105–112.

Publication types

MeSH terms