. 2008 Dec;118(12):3860-9.
doi: 10.1172/JCI35012. Epub 2008 Nov 6.

A subpopulation of mouse esophageal basal cells has properties of stem cells with the capacity for self-renewal and lineage specification

Affiliations

A subpopulation of mouse esophageal basal cells has properties of stem cells with the capacity for self-renewal and lineage specification

Jiri Kalabis et al. J Clin Invest. 2008 Dec.

Abstract

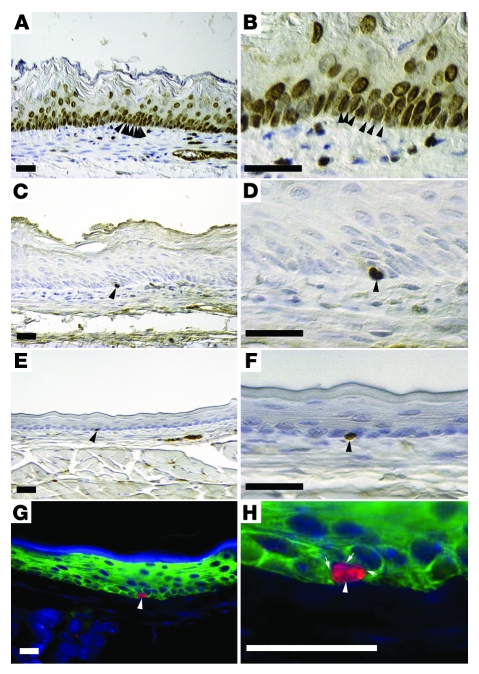
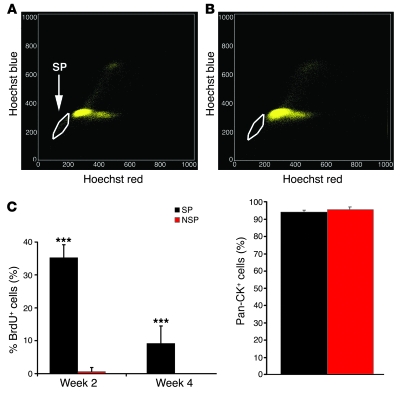
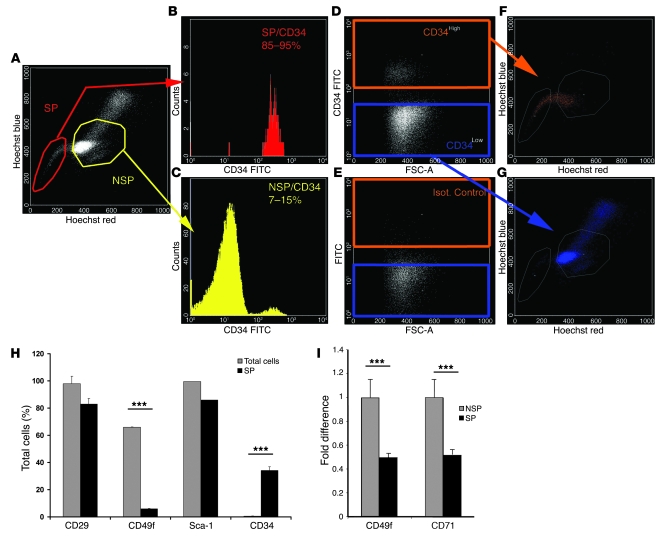
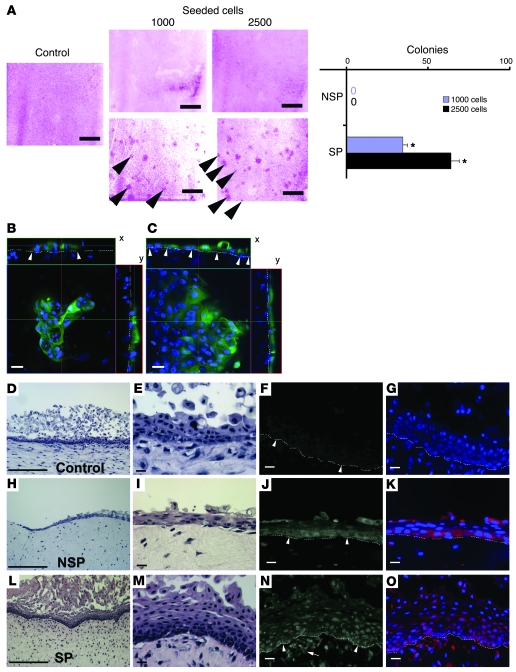
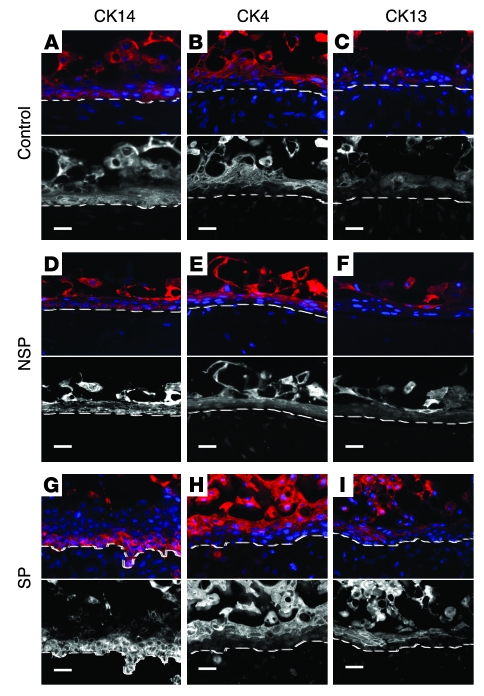
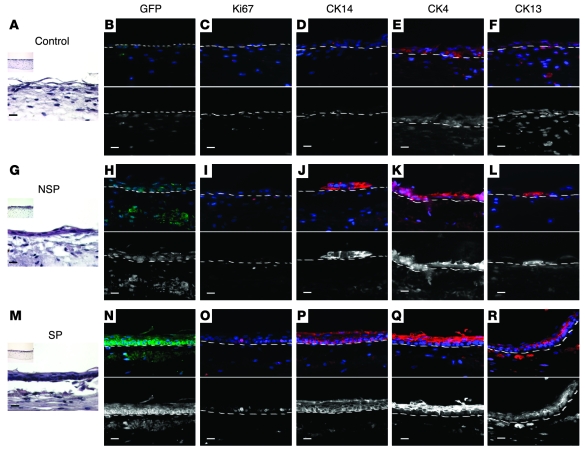
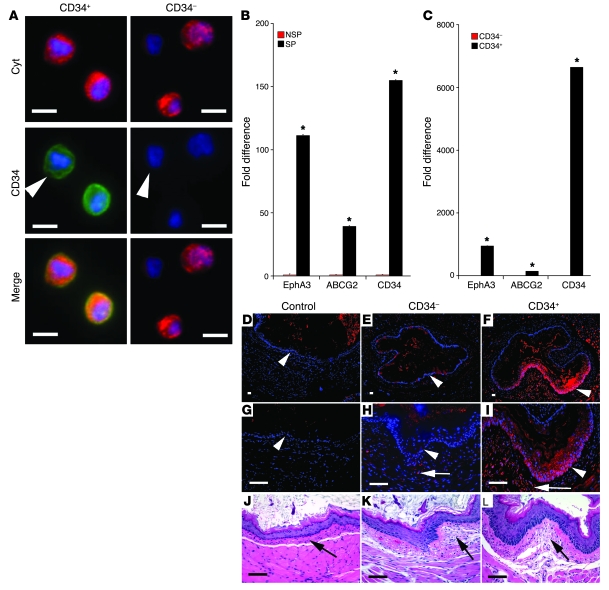
The esophageal epithelium is a prototypical stratified squamous epithelium that exhibits an exquisite equilibrium between proliferation and differentiation. After basal cells proliferate, they migrate outward toward the luminal surface, undergo differentiation, and eventually slough due to apoptosis. The identification and characterization of stem cells responsible for the maintenance of the esophageal epithelium remains elusive. Here, we employed Hoechst dye extrusion and BrdU label-retaining assays to identify in mice a potential esophageal stem cell population that localizes to the basal cell compartment. The self-renewing capacity of this population was characterized using a clonogenic assay and a 3D organotypic culture model. The putative esophageal stem cells were also capable of epithelial reconstitution in vivo in direct esophageal epithelial injury models. In both the 3D organotypic culture and direct mucosal injury models, the putative stem cells gave rise to undifferentiated and differentiated cells. These studies therefore provide a basis for understanding the regenerative capacity and biology of the esophageal epithelium when it is faced with injurious insults.


Figures

Figure 1
Figure 1. BrdU LRCs reside in the basal compartment.
(A and B) After 1 month of BrdU administration and immediate processing of tissues, almost all basal cells were BrdU+ (arrowheads). Original magnification, ×100 (A), ×400 (B). (CF) BrdU+ cells (arrowheads) were restricted in their spatial localization after 1 month of BrdU administration and 2 weeks (C and D) and 4 weeks (E and F) of tissue processing after cessation of BrdU administration. Original magnification, ×100 (C and E), ×400 (D and F). (G and H) Immunofluorescence revealed that BrdU+ cells (red; arrowhead) were pan-CK+ (green; arrows), establishing their epithelial origin. Nuclei were counterstained with DAPI. Original magnification, ×100 (G), ×400 (H). Scale bars: 25 μm.
Figure 2
Figure 2. Esophageal epithelial cell SP is present with Hoechst 33352 dye extrusion.
(A) Freshly isolated mouse esophageal epithelial cells were stained with Hoechst 33342 dye and subjected to flow cytometry–based cell sorting. When cells were sorted based upon size (forward and side scatter), there was a characteristic SP (outlined region), defined by low fluorescence for both Hoechst 33342 red and Hoechst 33342 blue. (B) SP cells were abolished with administration of verapamil (outlined region). (C) Left: The percentage of BrdU+ cells was substantially higher in SP cells than in NSP cells at weeks 2 and 4. Right: SP and NSP cells were pan-CK+ when quantified (SP, 94.8% ± 1.6%; NSP, 91.6% ± 1.38%). ***P < 0.001.
Figure 3
Figure 3. CD34 is a marker of esophageal epithelial SP cells.
Freshly isolated esophageal keratinocytes were stained with Hoechst and CD34. (A) SP (outlined in red) and NSP (outlined in yellow) cells. (B) SP cells were highly positive (85%–95%) for CD34, and (C) the NSP cells were CD34lo (7%–15% positive). Similarly, when cells were sorted based upon CD34 expression (D), CD34hi cells (orange) accumulated mostly in the original SP area of the Hoechst red/blue plot (F), while CD34lo cells (blue) accumulated mostly in the NSP area (G). (E) Isotype antibody control. (H) Quantitation of FACS expression of CD29, CD49f, Sca-1, and CD34 on SP versus total cells (***P < 0.001; n = 3 for CD29, CD49f, and Sca-1; n = 5 for CD34). (I) Fold difference of CD49f and CD71 expression in SP cells compared with NSP cells, analyzed using RT-PCR. (***P < 0.001, n = 3). Data represent mean ± SEM.
Figure 4
Figure 4. SP cells have stem cell properties in clonogenic and in 3D organotypic culture assays.
(A) When SP, NSP, and unsorted control cells were grown for 4 weeks, there were 34.33 ± 2.84 colonies with 1,000 SP cells and 64 ± 4.93 colonies with 2,500 SP cells (n = 3 experiments), compared with absent colonies with control or NSP cells (n = 3 experiments). Arrowheads indicate colonies. *P < 0.001 compared with NSP. (B) Two-photon microscopy of the disordered cells on the organotypic culture (day 12) after seeding 103 NSP cells isolated from GFP+ mice (green) with DAPI+ nuclei (blue); top view, z-stack, 53.8 μm in 0.78-μm increments. (C) Two-photon microscopy of the fully formed epithelium on day 12 after seeding 103 SP cells isolated from GFP+ mice (green) with DAPI+ nuclei (blue); top view, z-stack, 60 μm in 1-μm increments. Arrowheads indicate basement membrane. (D and E) Unsorted GFP cells (3 × 10⁴) did not form a complete epithelium. (F) GFP immunohistochemistry and (G) DAPI+ nuclei. (H and I) Sorted 103 NSP cells from GFP+ mice mixed with 3 × 10⁴ unsorted GFP cells did not form a complete epithelium. (J) Mosaic GFP+ pattern and (K) DAPI+ nuclei. (L and M) SP cells (103) from GFP+ mice mixed with 3 × 10⁴ unsorted GFP cells. There was complete epithelial formation with keratinization. (N) GFP+ immunohistochemistry and (O) DAPI+ nuclei. Dotted line in BO indicates basement membrane. Scale bars: 5 mm (A), 25 μm (BO). Original magnification, ×20 (A); ×100 (D, H, and L); ×200 (B and C); ×400 (EG, IK, and MO).
Figure 5
Figure 5. SP cells are able to differentiate in organotypic culture, giving rise to proliferative basal CK14+CK13CK4 and differentiated suprabasal CK14CK13+CK4+ cells.
(AC) Unsorted freshly isolated WT (GFP) cells did not form an epithelium layer (similar to data shown in Figure 4) with immunohistochemical staining for (A) CK14, (B) CK4, and (C) CK13. (DF) Sorted 103 NSP cells from GFP+ mice mixed with 3 × 10⁴ unsorted GFP cells did not form an epithelium (similar to data shown in Figure 4) with immunohistochemical staining for (D) CK14, (E) CK4, and (F) CK13. (GI) SP cells (103) from GFP+ mice mixed with 3 × 10⁴ unsorted GFP cells formed a complete epithelium with luminal keratinization (similar to data shown in Figure 4) with well-defined proliferative basal and differentiated suprabasal cells. Immunohistochemical staining for (G) CK14, (H) CK4, and (I) CK13. Dashed lines indicate the basement membrane. Original magnification, ×400. Scale bar: 25 μm.
Figure 6
Figure 6. SP GFP+ derived cells form a complete epithelium in organotypic culture upon serial passage.
Samples were harvested with trypsin after formation of the primary epithelium (described in Figures 4 and 5) and harvested again after the initial organotypic culture for the second organotypic culture. (A) There were only a few scattered epithelial cells in serial samples prepared form the organotypic cultures of unsorted WT (GFP) cells (H&E staining). (BF) Immunohistochemistry revealed that the cells were GFP (B), Ki67 (C), CK14 (D), CK4 (E), and CK13 (F). (G) Only a few isolated clusters of epithelial cells did not form an epithelium from 103 NSP cells from GFP+ mice mixed with 3 × 10⁴ unsorted GFP cells (H&E staining). (HL) Immunohistochemistry revealed that the cells were mostly GFP (H), Ki67 (I), minimally and irregularly CK14+ (J) and CK4+ (K), and CK13+ (L). (M) A complete epithelium formed, derived from sorted 103 SP cells from GFP+ mice mixed with 3 × 10⁴ unsorted GFP cells (H&E staining). (NR) Immunohistochemistry revealed that cells were GFP+ (N), basal cells were Ki67+ (O) and CK14+ (P), and suprabasal cells were CK4+ (Q) and CK13+ (R). Dashed line represents basement membrane. Original magnification, ×100 (insets in A, G, and M); ×400 (BF, HL, and NR). Scale bars: 25 μm.
Figure 7
Figure 7. CD34+GFP+ cells have the capacity to contribute to esophageal epithelial restitution after induction of injury.
(A) CD34+ (green) or CD34 (red) esophageal epithelial cells were CK+ (94.8% ± 1.66% or 91.24% ± 1.38% by FACS, respectively; data not shown), and nuclei were stained with DAPI (blue). Original magnification, ×1,000. Scale bars: 5 μm. (B) Comparison of selected markers (CD34, ABCG2, EphA3) in SP cells normalized to NSP cells by RT-PCR (*P < 0.01 compared with NSP; n = 3 experiments). (C) Comparison of selected markers in CD34+ cells normalized to CD34 cells by RT-PCR (*P < 0.01 compared with CD34; n = 3 experiments). In B and C, data are mean ± SEM. (D, G, and J) PBS (control) was injected in the submucosa after mucosal injury. The epithelium reformed after 48 hours. There were no GFP+ cells (red) in PBS-injected tissues. (E, H, and K) CD34GFP+ cells (3 × 10⁴) were injected into the submucosa after induction of mucosal injury. The epithelium re-formed after 48 hours. There were few GFP+ cells (red) in the epithelium. (F, I, and L) CD34+GFP+ cells (3 × 10⁴) were injected into the submucosa after induction of mucosal injury. The epithelium re-formed after 48 hours. The re-formed epithelium was GFP+, consistent with the migration of stem cells and emergence of differentiated lineages. Some GFP+ cells remained in the submucosa. Arrowheads indicate basement membrane. Arrows indicate site of cell injection in the submucosa. Original magnification, ×40 (DF); ×100 (GL). Scale bars: 25 μm.

References

    1. Wagner W., et al. Molecular evidence for stem cell function of the slow-dividing fraction among human hematopoietic progenitor cells by genome-wide analysis. Blood. 2004;104:675–686. doi: 10.1182/blood-2003-10-3423. - DOI - PubMed
    1. Cairnie, A., Lala, P., and Osmond, D. 1976. Stem cells of renewing cell populations. Academic Press. New York, New York, USA. 225–261.
    1. Potten, C., and Lord, B. 1983. Stem cells: their identification and characterization. Churchill Livingstone. London, United Kingdom. 200–232.
    1. Potten, C. 1997. Stem cells. Academic Press. London, United Kingdom. 1–27.
    1. Potten C.S., Bullock J.C. Cell kinetic studies in the epidermis of the mouse. I. Changes in labeling index with time after tritiated thymidine administration. Experientia. 1983;39:1125–1129. doi: 10.1007/BF01943142. - DOI - PubMed

Publication types