

Comparative analysis of brain lipids in mice, cats, and humans with Sandhoff disease
- PMID: 19034545
- PMCID: PMC3586256
- DOI: 10.1007/s11745-008-3268-0
Comparative analysis of brain lipids in mice, cats, and humans with Sandhoff disease
Abstract
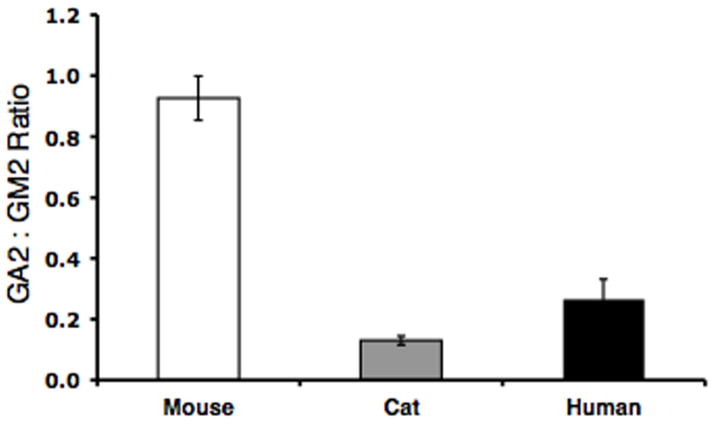
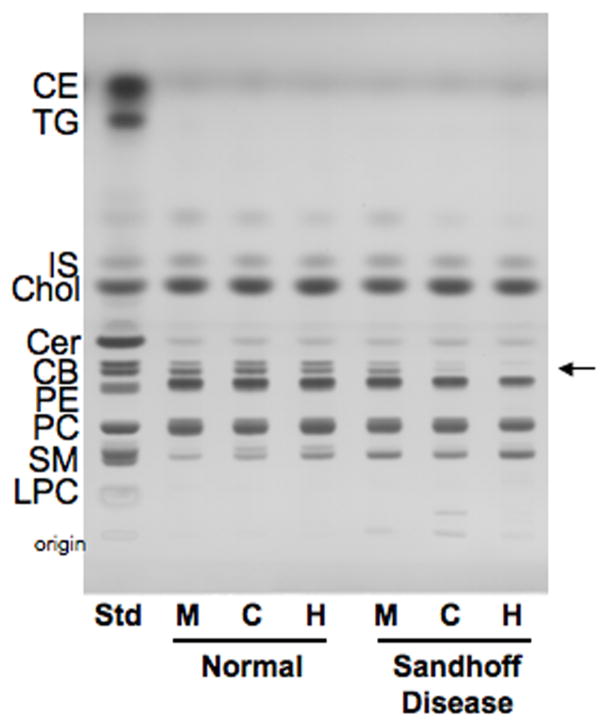
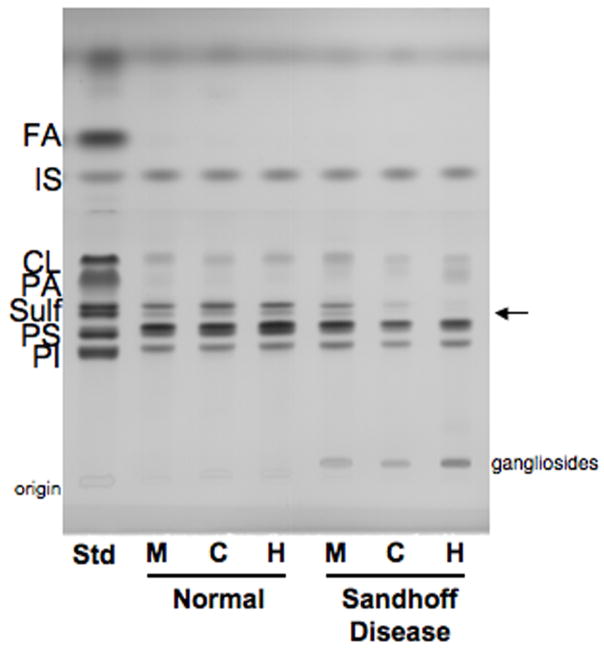
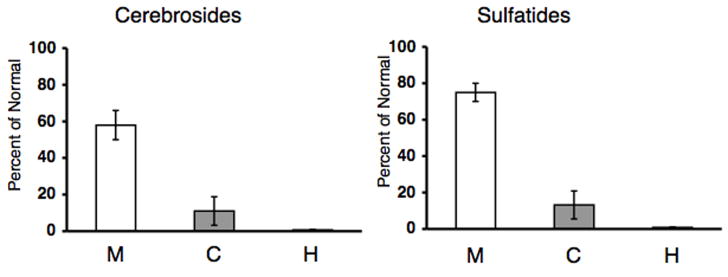
Sandhoff disease (SD) is a glycosphingolipid (GSL) storage disease that arises from an autosomal recessive mutation in the gene for the beta-subunit of beta-Hexosaminidase A (Hexb gene), which catabolizes ganglioside GM2 within lysosomes. Accumulation of GM2 and asialo-GM2 (GA2) occurs primarily in the CNS, leading to neurodegeneration and brain dysfunction. We analyzed the total lipids in the brains of SD mice, cats, and humans. GM2 and GA2 were mostly undetectable in the normal mouse, cat, and human brain. The lipid abnormalities in the SD cat brain were generally intermediate to those observed in the SD mouse and the SD human brains. GM2 comprised 38, 67, and 87% of the total brain ganglioside distribution in the SD mice, cats, and humans, respectively. The ratio of GA2-GM2 was 0.93, 0.13, and 0.27 in the SD mice, cats, and humans, respectively, suggesting that the relative storage of GA2 is greater in the SD mouse than in the SD cat or human. Finally, the myelin-enriched lipids, cerebrosides and sulfatides, were significantly lower in the SD brains than in the control brains. This study is the first comparative analysis of brain lipids in mice, cats, and humans with SD and will be important for designing therapies for Sandhoff disease patients.
Figures

References
-
- Neufeld EF. Lysosomal storage diseases. Annu Rev Biochem. 1991;60:257–280. - PubMed
-
- Gravel RA, Clarke JTR, Kaback MM, Mahuran D, Sandhoff K, Suzuki K. The GM2 gangliosidoses. In: Scriver CR, Beaudet AL, Sly WS, Valle D, editors. The Metabolic and Molecular Bases of Inherited Disease. 7. McGraw-Hill, Inc.; New York: 1995.
-
- Chavany C, Jendoubi M. Biology and potential strategies for the treatment of GM2 gangliosidoses. Molecular medicine today. 1998;4:158–165. - PubMed
-
- Jeyakumar M, Smith DA, Williams I, Borja MC, Neville DCA, Butters TD, Dwek RA, Platt FM. Anti-inflammatory and anti-oxident therapies increase survival in the Sandhoff disease mouse: synergy with N-butyldeoxynojirimycin. Ann Neurology. 2004 (in press) - PubMed
-
- Jeyakumar M, Butters TD, Dwek RA, Platt FM. Glycosphingolipid lysosomal storage diseases: therapy and pathogenesis. Neuropathol Appl Neurobiol. 2002;28:343–357. - PubMed
Publication types
MeSH terms
Substances
Grants and funding
LinkOut - more resources
Full Text Sources
Other Literature Sources
Miscellaneous
