

Mesenchymal stem cell and nucleus pulposus cell coculture modulates cell profile
- PMID: 19034596
- PMCID: PMC2772905
- DOI: 10.1007/s11999-008-0623-7
Mesenchymal stem cell and nucleus pulposus cell coculture modulates cell profile
Abstract
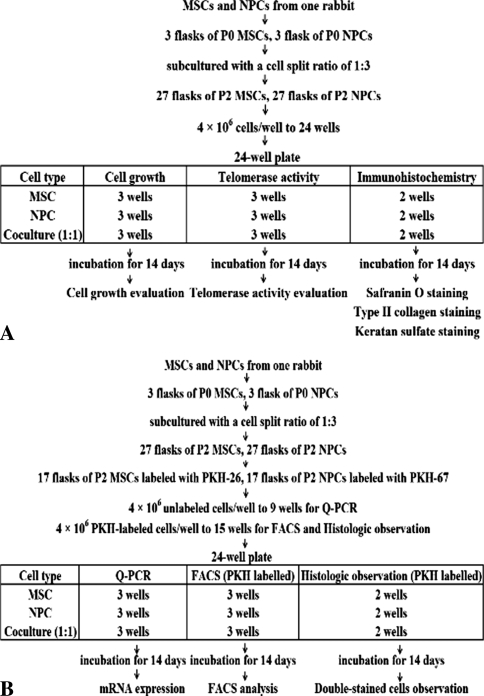
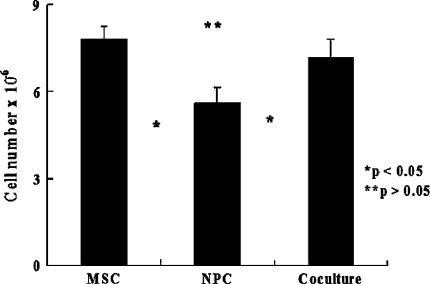
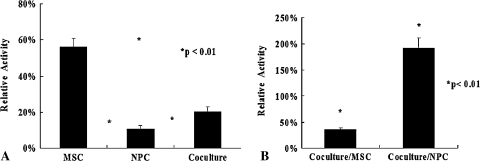
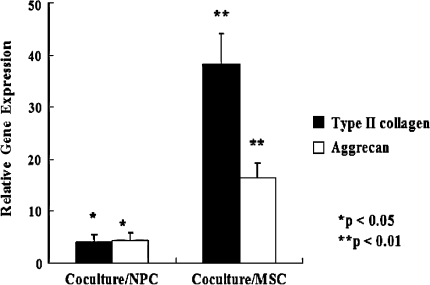
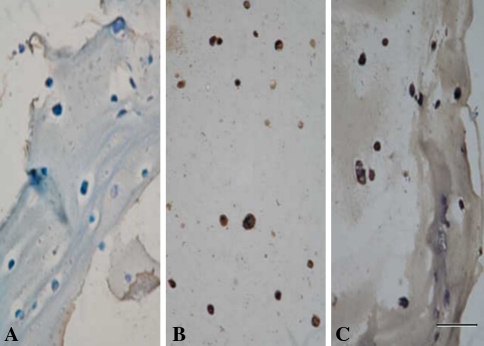
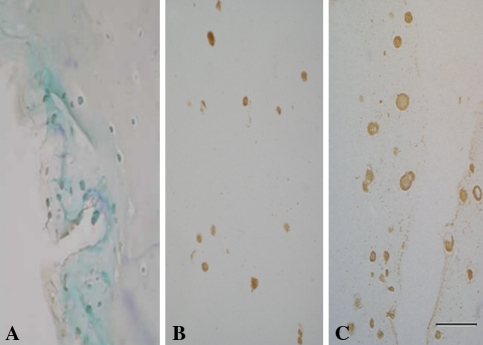
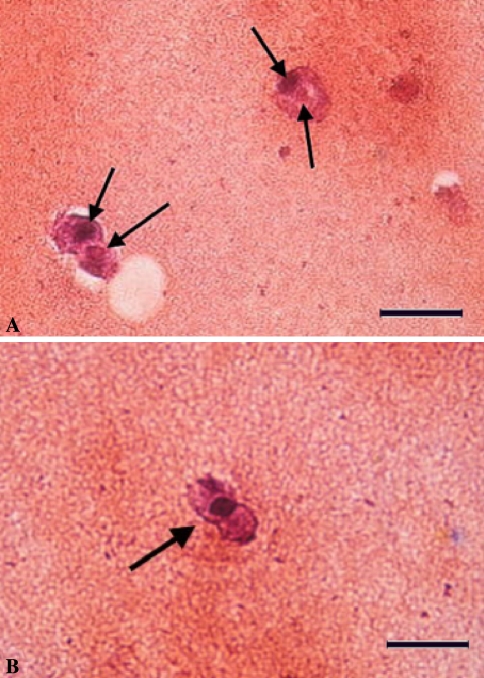
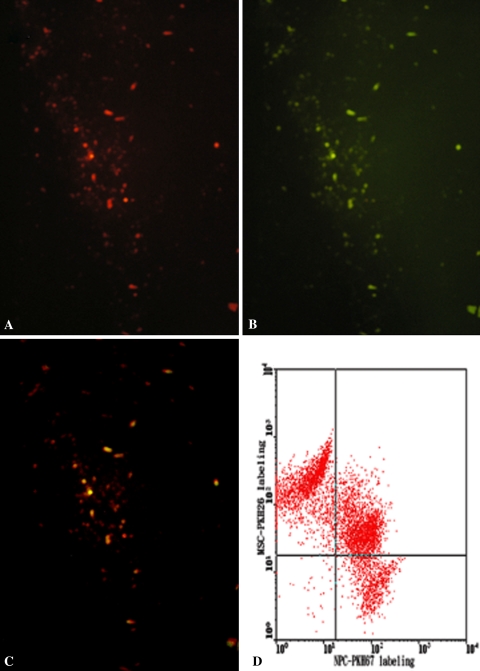
Spontaneous cell fusion can occur in cocultured stem cells. We examined whether telomerase activity change and cell fusion occurred in mesenchymal stem cell (MSC) and nucleus pulposus cell (NPC) coculture. MSCs and NPCs were labeled with PKH26 and PKH67 dyes and cocultured at a 50:50 ratio. An equal number of MSCs or NPCs were used as the control. After 14 days, cells were evaluated by cell growth, telomerase activity, quantitative reverse transcriptase-polymerase chain reaction (RT-PCR), immunohistochemistry, and histologic observation. Cell fusion was confirmed by microscopic observation and fluorescence-activated cell sorter (FACS) analysis. The results suggested cell growth rate and telomerase activity were higher in cocultured cells than in NPCs cultured alone. The mRNA expression levels of the Type II collagen and aggrecan were elevated in cocultured cells. Immunohistochemical analysis revealed positive staining for Type II collagen and keratan sulfate in NPCs cultured alone and in a proportion of cocultured cells. Histologic observation revealed binucleated cocultured cells expressed both PKH dyes in the same location and slide focus. The FACS analysis revealed 42% of cocultured cells were double-stained. Cocultured cells partially maintained the NPC phenotype. The partially maintained phenotype of the NPCs may be attributable to spontaneous cell fusion in association with increased telomerase activity.
Figures
References
-
- {'text': '', 'ref_index': 1, 'ids': [{'type': 'DOI', 'value': '10.1006/excr.1998.4287', 'is_inner': False, 'url': 'https://doi.org/10.1006/excr.1998.4287'}, {'type': 'PubMed', 'value': '9882522', 'is_inner': True, 'url': 'https://pubmed.ncbi.nlm.nih.gov/9882522/'}]}
- Aguiar DJ, Johnson SL, Oegema TR Jr. Notochordal cells interact with nucleus pulposus cells: regulation of proteoglycan synthesis. Exp Cell Res. 1999;246:129–137. - PubMed
-
- {'text': '', 'ref_index': 1, 'ids': [{'type': 'DOI', 'value': '10.1038/nature02069', 'is_inner': False, 'url': 'https://doi.org/10.1038/nature02069'}, {'type': 'PubMed', 'value': '14555960', 'is_inner': True, 'url': 'https://pubmed.ncbi.nlm.nih.gov/14555960/'}]}
- Alvarez-Dolado M, Pardal R, Garcia-Verdugo JM, Fike JR, Lee HO, Pfeffer K, Lois C, Morrison SJ, Alvarez-Buylla A. Fusion of bone-marrow-derived cells with Purkinje neurons, cardiomyocytes and hepatocytes. Nature. 2003;425:968–973. - PubMed
-
- {'text': '', 'ref_index': 1, 'ids': [{'type': 'DOI', 'value': '10.1634/stemcells.20-6-501', 'is_inner': False, 'url': 'https://doi.org/10.1634/stemcells.20-6-501'}, {'type': 'PubMed', 'value': '12456958', 'is_inner': True, 'url': 'https://pubmed.ncbi.nlm.nih.gov/12456958/'}]}
- Askenasy N, Farkas DL. Optical imaging of PKH-labeled hematopoietic cells in recipient bone marrow in vivo. Stem Cells. 2002;20:501–513. - PubMed
-
- {'text': '', 'ref_index': 1, 'ids': [{'type': 'DOI', 'value': '10.1126/science.279.5349.349', 'is_inner': False, 'url': 'https://doi.org/10.1126/science.279.5349.349'}, {'type': 'PubMed', 'value': '9454332', 'is_inner': True, 'url': 'https://pubmed.ncbi.nlm.nih.gov/9454332/'}]}
- Bodnar AG, Ouellette M, Frolkis M, Holt SE, Chiu CP, Morin GB, Harley CB, Shay JW, Lichtsteiner S, Wright WE. Extension of life span by introduction of telomerase into normal human cells. Science. 1998;279:349–352. - PubMed
-
- {'text': '', 'ref_index': 1, 'ids': [{'type': 'DOI', 'value': '10.1002/jcb.20886', 'is_inner': False, 'url': 'https://doi.org/10.1002/jcb.20886'}, {'type': 'PubMed', 'value': '16619257', 'is_inner': True, 'url': 'https://pubmed.ncbi.nlm.nih.gov/16619257/'}]}
- Caplan AI, Dennis JE. Mesenchymal stem cells as trophic mediators. J Cell Biochem. 2006;98:1076–1084. - PubMed
MeSH terms
Substances
LinkOut - more resources
Full Text Sources
