. 2008 Nov 26:5:107.
doi: 10.1186/1742-4690-5-107.

Biphasic decay kinetics suggest progressive slowing in turnover of latently HIV-1 infected cells during antiretroviral therapy

Affiliations

Biphasic decay kinetics suggest progressive slowing in turnover of latently HIV-1 infected cells during antiretroviral therapy

Marek Fischer et al. Retrovirology. .

Abstract

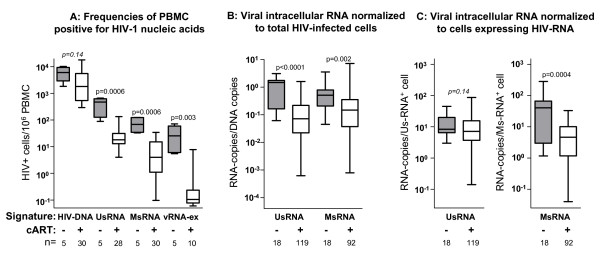
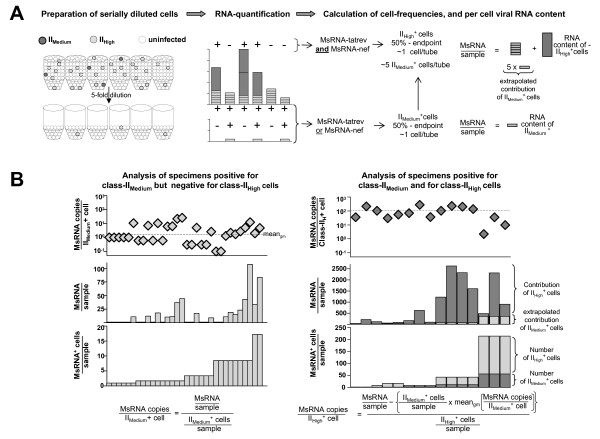
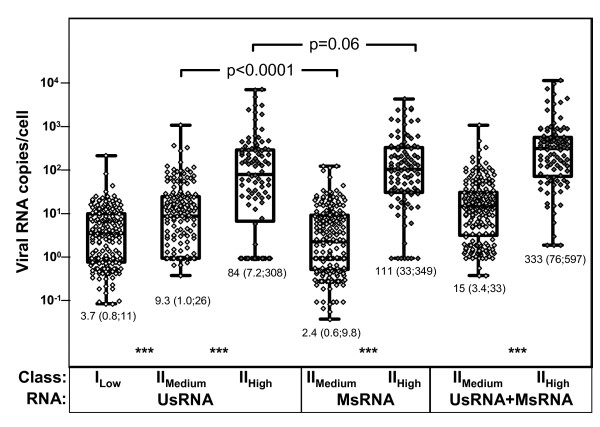
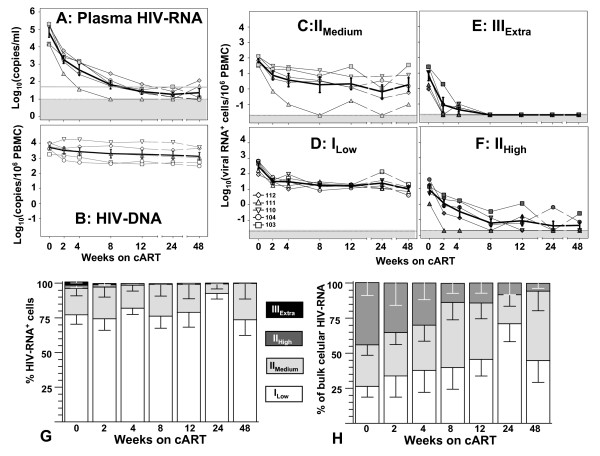
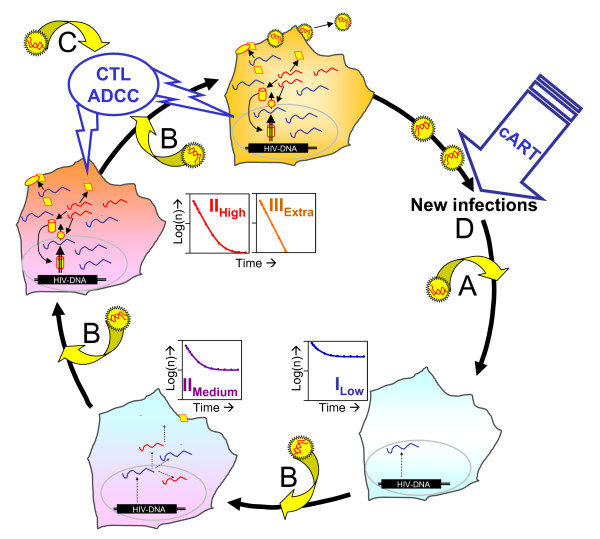
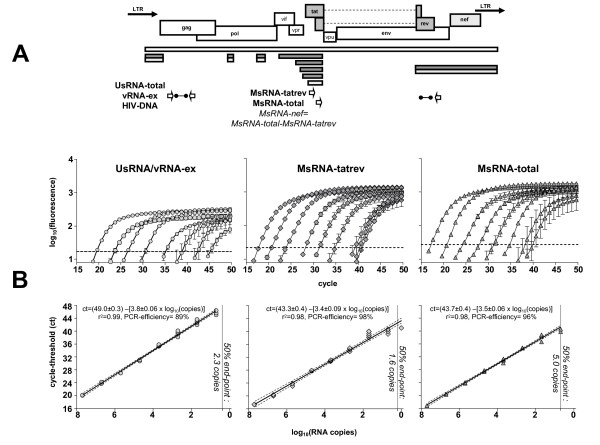
Background: Mathematical models based on kinetics of HIV-1 plasma viremia after initiation of combination antiretroviral therapy (cART) inferred HIV-infected cells to decay exponentially with constant rates correlated to their strength of virus production. To further define in vivo decay kinetics of HIV-1 infected cells experimentally, we assessed infected cell-classes of distinct viral transcriptional activity in peripheral blood mononuclear cells (PBMC) of five patients during 1 year after initiation of cART RESULTS: In a novel analytical approach patient-matched PCR for unspliced and multiply spliced viral RNAs was combined with limiting dilution analysis at the single cell level. This revealed that HIV-RNA+ PBMC can be stratified into four distinct viral transcriptional classes. Two overlapping cell-classes of high viral transcriptional activity, suggestive of a virion producing phenotype, rapidly declined to undetectable levels. Two cell classes expressing HIV-RNA at low and intermediate levels, presumably insufficient for virus production and occurring at frequencies exceeding those of productively infected cells matched definitions of HIV-latency. These cells persisted during cART. Nevertheless, during the first four weeks of therapy their kinetics resembled that of productively infected cells.

Conclusion: We have observed biphasic decays of latently HIV-infected cells of low and intermediate viral transcriptional activity with marked decreases in cell numbers shortly after initiation of therapy and complete persistence in later phases. A similar decay pattern was shared by cells with greatly enhanced viral transcriptional activity which showed a certain grade of levelling off before their disappearance. Thus it is conceivable that turnover/decay rates of HIV-infected PBMC may be intrinsically variable. In particular they might be accelerated by HIV-induced activation and reactivation of the viral life cycle and slowed down by the disappearance of such feedback-loops after initiation of cART.


Figures

Figure 1
Figure 1
Antiretroviral therapy mediated decreases in HIV-infected cells and average cellular viral transcriptional activity. HIV-RNA (UsRNA, MsRNA, vRNA-ex), HIV-DNA levels and frequencies of PBMC positive for HIV-RNAs were measured before start of cART (grey boxes) and at six time-points during treatment (white boxes). Signature signifies the type of viral nucleic acid measured for determination of infected cell-numbers. Sample sizes in each group (n = sample numbers, analysis of 5 patients, one time point before cART, six time-points during therapy, only data of time points with PCR-positive samples were included) are indicated below diagrams and p-values of Mann-Whitney comparison of treated versus untreated groups are indicated above. Groups are displayed as "box and whiskers" showing the median, 75% percentiles and range of each data set. A: Frequencies of total infected PBMC, as represented by HIV-DNA levels and frequencies of PBMC expressing viral RNAs determined by limiting dilution as described in figure 2. (B: Average per-cell expression of intracellular viral RNAs (UsRNA, MsRNA) normalized to HIV-DNA (representing the total number of HIV-infected cells). C: Average per-cell expression of intracellular viral RNAs normalized to the numbers of PBMC expressing viral RNA. To favour sampling of balanced average populations, solely viral RNA measurements from specimens containing more than 106 PBMC were analyzed in B and C (n = 2–6 per time-point and patient).
Figure 2
Figure 2
Outline of experimental strategy. A: Algorithm for combining limiting dilution of cells with RT-PCR. HIV-RNAs (in this example MsRNAs) of serial 5-fold dilutions of cells (left panel) are measured by RT-PCR (middle panel). Analysis of replicates of each dilution (right panel) reveals both the viral RNA content and the frequencies (estimated by 50% end-points) HIV-RNA+ cells. Applying criteria listed in table 1, in this case expression of either MsRNA-tatrev or MsRNA-nef (class-IIMedium) and expression of both MsRNA-tatrev and MsRNA-nef (class-IIHigh), cell classes differing in HIV-RNA content can be discerned. Specific HIV-RNA expression in each class of MsRNA+ cells can then be normalized by dividing MsRNA copies by the numbers of infected cells. In specimens positive for class-IIHigh cells which always contain class-IIMedium, the contribution of class-IIMedium needs to be considered (see formulas in panel B). Note that analysis of UsRNA contents in different cell-classes followed the same schemes. B: Analysis of specific MsRNA per-cell expression exemplified for patient 112. MsRNA expression (middle panels) was normalized to the number of HIV-RNA+ cells (bottom panels) resulting in MsRNA expression per cell (top panels). The left three panels comprise specimens positive for class-IIMedium expression only. In the right three panels indicating specimens positive for class-IIHigh MsRNA, the average contribution of class-IIMedium+ cells (light grey bars) was subtracted from MsRNA copy numbers before normalization to the number of class-IIHigh + cells. The dotted lines in the top panels show the geometric means (meangm) of all data-points. Note that RNA copies per sample and frequencies of MsRNA+ cells (middle and bottom panels) are depicted in a linear scale which may result in column heights hardly discernible from zero. Formulas at the bottom describe the calculations performed. Bars show PCR results of separate replicates of PBMC dilutions, horizontal axes in the diagrams have no dimension
Figure 3
Figure 3
Transcriptional signatures in HIV-infected PBMC in vivo. Per-cell viral RNA expression levels as calculated after assignment of specimens to the transcriptional classes ILow, IIMedium and IIHigh (table 1). Only unique specimens devoid of cells of a higher expression category were analyzed in each expression class. Thus unique class-ILow positive samples are devoid of class-IIMedium and class-IIHigh cells, unique class IIMedium specimens are devoid of class-IIHigh. Data were pooled from all patients because separate analyses of single patients showed similar distributions (data not shown). "Box and whiskers" show the ranges, medians and interquartile ranges of the data displayed by single symbols. Numbers below columns indicate medians (quartiles), p-values above columns show significance levels of paired (Wilcoxon signed rank test) comparisons. *** indicates p-values < 0.0001 of (unpaired) Mann-Whitney testing between neighbouring columns.
Figure 4
Figure 4
Kinetics of HIV-1 during cART. A: Plasma viremia shown by log10 transformed plasma RNA copy numbers. B: Total HIV-1 infected cells shown by log10 transformed copy numbers of HIV-1 DNA. C; D: Latently infected cells shown by log10 transformed numbers of HIV-RNA+ PBMC of cell classes ILow (D) and IIMedium(C). E, F: Cells with increased viral transcription shown by log10 transformed numbers of class IIHigh (F) and IIIExtra (E). G: Mean (± sem) distribution of HIV-RNA+ cells during cART. H: Mean (± sem) contribution of different HIV-RNA+ cell classes to bulk cellular viral RNA as assessed by the sum of UsRNA and MsRNA in total RNA extracts. Data in A-F are depicted and connected with thin black lines for each patient (see symbols in the bottom of panel D). Dotted lines and the grey shaded bars in panels A and C-F show the estimated detection limit of limiting dilution analyses for HIV-RNA+ PBMC. Symbols coinciding with detection limits signify time points with undetectable viral RNA. Thick black lines depict (log10 transformed) means (± sem) of the pooled data from all 5 patients. The grey line in panel A indicates the clinically used threshold of 50 RNA copy per ml.
Figure 5
Figure 5
A model of the turnover of HIV-RNA+ cells during the viral life-cycle. The displayed cells symbolize HIV-1 infected cells of classes ILow (blue), IIMedium (blue/magenta), IIHigh (magenta/red) and IIIExtra (brown). Inserts within the circle symbolize the kinetics of each cell class during cART. Viral particles are depicted as black/yellow stars with the enclosed genomic RNA (vRNA-ex) in red. Viral proteins are shown as red/yellow diamonds, ellipses, circles and cylinders. Viral intracellular RNA is displayed as blue (UsRNA) or red (MsRNA) lines. Buckled arrows attached to viral particles signify the direct or indirect influences of activation due to ongoing viral replication and the presence of viremia on the viral life cycle [24,43-46]. A: Immune activation can promote post-entry events in resting CD4+ T cells harboring free viral cDNA such as integration and initiation of viral transcription [25,26,43]. B: Nonspecific immune activation can induce transcription in latently infected cells [27,47] and may result in a acceleration of viral replication [15,45]. C: CD8 T-cell mediated cytoxicity (CTL) [39,40] and humoral immunity [41], such as antibody-dependent cellular cytotoxicity (ADCC) and complement effector functions [28], are prone to attack HIV-1 infected cells expressing viral antigens. D: After initiation of cART, the viral life cycle is slowed primarily by preventing new infections but also by decreasing immune activation which results in decelerated rates of integration, detained induction of latency and reduced immune mediated HIV-specific cytotoxicity (A, B, C).
Figure 6
Figure 6
PCR-Quantification of HIV-RNAs. A: Location of primers and probes used for PCR. Labeled bars depict viral genes and the unlabelled bars below show exons of viral transcripts quantified as previously described [15]. White: genomic RNA spanning the entire transcriptional unit, grey: multiply spliced RNAs encoding tat and rev (dark grey) or nef (light grey). Arrows show the location of PCR primers and barbells the positioning of fluorescent probes. Note that MsRNA-nef was calculated as the difference of copy number for MsRNA-total and MsRNA-tatrev as described previously [15] (formula indicated in italic letters). B: Performance of PCR assays. Patient-specific in vitro transcribed UsRNA and MsRNA prepared from templates isolated from patient 104 and quantified photometrically was subjected to RT-PCR using patient specific primers as listed in table 3. Ten-fold dilutions ranging from 5 × 10⁷ – 5 copies were run in replicates of two (5 × 10⁷ – 5 × 10⁴ copies) or four (5000–5 copies). Upper panels show amplification plots (mean ± standard error) with the amplification threshold (broken lines) as calculated by default settings of the software used (i-cycler, Biorad). In the lower panels log-transformed copy numbers were plotted against cycle-threshold (ct) values of each replicate. Linear regression analysis as shown by the resulting equations for black lines (broken lines depict 95% confidence intervals) revealed high correlation coefficients of standard curves. PCR efficiencies as deduced from slopes ranged from 89%–96%. Sensitivities of PCR assays (grey vertical lines, italic numbers) were estimated by determination of 50% endpoints [51]. All assays approached single copy sensitivities as previously documented [15,22] with assays for MsRNA-tatrev (1.6 copies) being the most sensitive ones followed by PCR for UsRNA/vRNA-ex (2.3 copies) and the assay for MsRNA-total (5 copies). PCR assays for the other patients performed similarly (data not shown).

References

    1. Carpenter C, Feinberg M, Aubry W, Averitt D, Coffin J, Cooper D, Follansbee S, Hamburg P, Harrington M, Hidalgo J, et al. Report of the NIH Panel to Define Principles of Therapy of HIV Infection. Ann Intern Med. 1998;128:1057–1078. - PubMed
    1. Perelson AS, Neumann AU, Markowitz M, Leonard JM, Ho DD. HIV-1 dynamics in vivo: virion clearance rate, infected cell life-span, and viral generation time. Science. 1996;271:1582–1586. doi: 10.1126/science.271.5255.1582. - DOI - PubMed
    1. Perelson AS, Essunger P, Cao Y, Vesanen M, Hurley A, Saksela K, Markowitz M, Ho DD. Decay characteristics of HIV-1-infected compartments during combination therapy. Nature. 1997;387:188–191. doi: 10.1038/387188a0. - DOI - PubMed
    1. Sachsenberg N, Perelson AS, Yerly S, Schockmel GA, Leduc D, Hirschel B, Perrin L. Turnover of CD4+ and CD8+ T lymphocytes in HIV-1 infection as measured by Ki-67 antigen. J Exp Med. 1998;187:1295–1303. doi: 10.1084/jem.187.8.1295. - DOI - PMC - PubMed
    1. Klenerman P, Phillips RE, Rinaldo CR, Wahl LM, Ogg G, May RM, McMichael AJ, Nowak MA. Cytotoxic T lymphocytes and viral turnover in HIV type 1 infection. Proc Natl Acad Sci USA. 1996;93:15323–15328. doi: 10.1073/pnas.93.26.15323. - DOI - PMC - PubMed

Publication types

Substances