. 2009 Feb;83(3):1299-311.
doi: 10.1128/JVI.01659-08. Epub 2008 Nov 26.

MAVS dimer is a crucial signaling component of innate immunity and the target of hepatitis C virus NS3/4A protease

Affiliations

MAVS dimer is a crucial signaling component of innate immunity and the target of hepatitis C virus NS3/4A protease

Martin Baril et al. J Virol. 2009 Feb.

Abstract

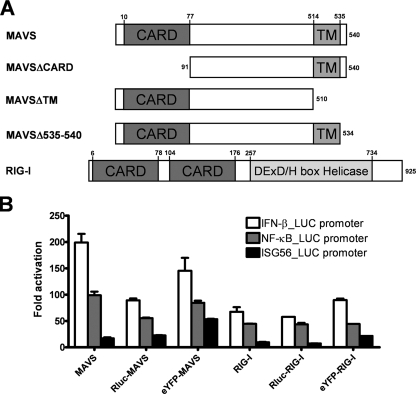
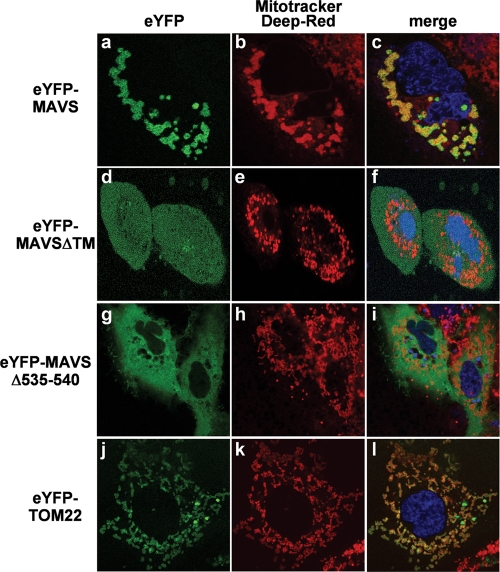
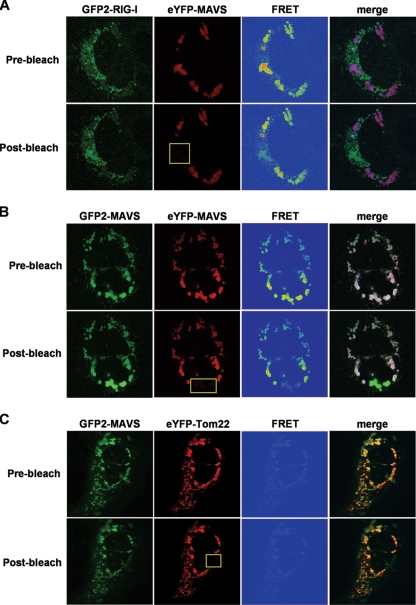
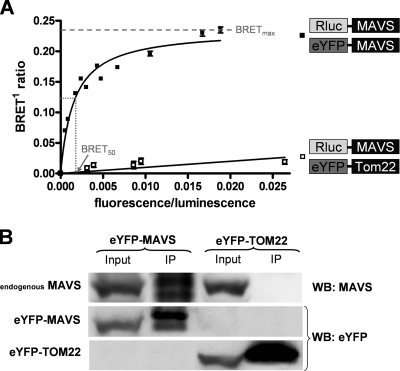
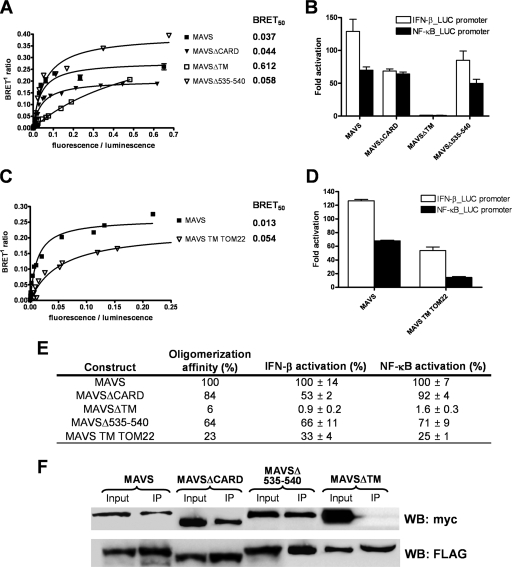
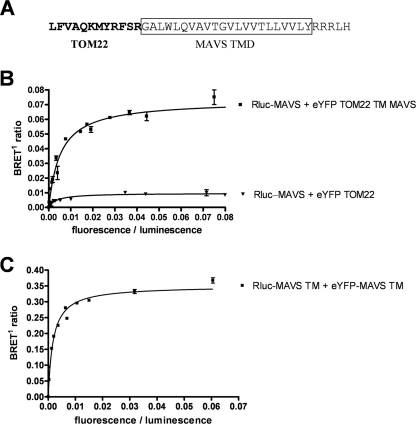
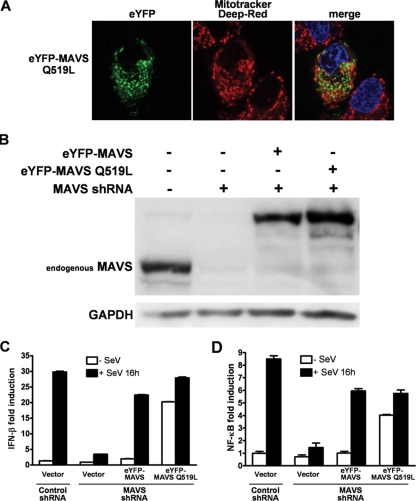
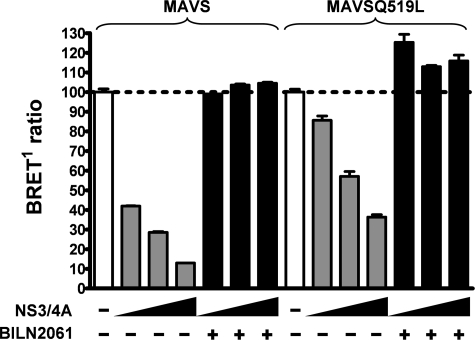
The mitochondrial antiviral signaling (MAVS) protein plays a central role in innate antiviral immunity. Upon recognition of a virus, intracellular receptors of the RIG-I-like helicase family interact with MAVS to trigger a signaling cascade. In this study, we investigate the requirement of the MAVS structure for enabling its signaling by structure-function analyses and resonance energy transfer approaches in live cells. We now report the essential role of the MAVS oligomer in signal transduction and map the transmembrane domain as the main determinant of dimerization. A combination of mutagenesis and computational methods identified a cluster of residues making favorable van der Waals interactions at the MAVS dimer interface. We also correlated the activation of IRF3 and NF-kappaB with MAVS oligomerization rather than its mitochondrial localization. Finally, we demonstrated that MAVS oligomerization is disrupted upon expression of HCV NS3/4A protease, suggesting a mechanism for the loss of antiviral signaling. Altogether, our data suggest that the MAVS oligomer is essential in the formation of a multiprotein membrane-associated signaling complex and enables downstream activation of IRF3 and NF-kappaB in antiviral innate immunity.


Figures

FIG. 1.
FIG. 1.
Schematic presentation of Rluc and eYFP constructs and their activation of the IFN-β promoter and the NF-κB- and IRF3-dependent promoters. (A) Domain structure of the MAVS and RIG-I constructs showing the position of the CARD and the TM and DexD/H box helicase domains. (B) Expression vectors for MAVS and RIG-I, either alone or in fusion with Rluc or eYFP, were cotransfected with an IFN-β-, NF-κB-, or ISG56-firefly luciferase reporter in 293T cells. Results are expressed as activation levels of the promoter compared to those in cells transfected with an empty expression vector. The error bars represent the standard deviations from the mean values obtained from three independent experiments performed in duplicate.
FIG. 2.
FIG. 2.
Live-cell confocal fluorescence imaging of eYFP fusion proteins and mitochondria. Fluorescence confocal microscopy was used to visualize an optical cross-section of live Huh7 cells. Forty-eight hours after transfection with various eYFP fusion proteins (green), mitochondria were stained with Mitotracker deep red (red) and nuclei were labeled with Hoechst 33342 (blue). Yellow labeling in the merge image indicates colocalization of eYFP fusion constructs with mitochondria.
FIG. 3.
FIG. 3.
RIG-I-MAVS and MAVS-MAVS interactions visualized by FRET and acceptor photobleaching. Four hours after infection with Sendai virus, fluorescence confocal microscopy was used to visualize an optical cross-section of live Huh7 cells coexpressing either GFP2-RIG-I (donor, green) and eYFP-MAVS (acceptor, red) (A), GFP2-MAVS and eYFP-MAVS (B), or GFP2-MAVS and eYFP-TOM22 (C). FRET images are represented with pixel-by-pixel FRET intensities, using a color code (from blue to red). Acceptor photobleaching was performed at 488 nm (yellow rectangle).
FIG. 4.
FIG. 4.
Oligomerization of MAVS identified by BRET and semiendogenous coimmunoprecipitation experiments. (A) BRET experiments with live 293T cells. Rluc-MAVS (BRET donor) was cotransfected with eYFP-MAVS (BRET acceptor) or eYFP-TOM22 (nonspecific control). Forty-eight hours later, energy transfer was initiated by the addition of the cell-permeable Rluc substrate coelenterazine h. Donor saturation curves were obtained by measuring the BRET in the presence of a fixed quantity of donor and increasing amounts of acceptor. The x axis shows the ratio between the fluorescence of the acceptor (YFP-YFP0, where YFP0 is the fluorescence value in cells expressing the BRET donor alone) and the luminescence of the donor. BRETmax is the maximal BRET signal reached by the saturation curve, whereas BRET50 is the concentration of acceptors giving 50% of BRETmax. Curves shown represent the means ± standard deviations of results from one representative experiment carried out in duplicate. The curves were fitted using a nonlinear regression equation, in which a single binding site was assumed (GraphPad Prism). (B) eYFP-MAVS or control eYFP-TOM22 constructs were transfected in 293T cells. After 48 h, cells were infected with Sendai virus for 4 h before cell lysates were immunoprecipitated (IP) with anti-GFP antibodies, followed by immunoblot analysis (WB) with anti-GFP (lower panels) and anti-MAVS (upper panel) antibodies.
FIG. 5.
FIG. 5.
The ability of MAVS to form oligomers correlates with its activation of IFN-β and NF-κB. (A) BRET saturation assays were performed as described for Fig. 4A. BRET50, which is a reflection of the relative affinity of the acceptor fusion for the donor fusion, is indicated to the right of the curve for every deletion mutant of MAVS. The curves shown represent the means ± standard deviations of results from one representative experiment carried out in duplicate. (B) Expression vectors for MAVS deletion mutants in fusion with the Rluc or eYFP were cotransfected with an IFN-β- or NF-κB-firefly luciferase reporter in 293T cells. The Rluc or eYFP activity of the fusion protein was used to normalize firefly luciferase activity. Results are expressed as average activation levels of the promoter in cells transfected with Rluc- or eYFP fusion proteins, compared to those in cells transfected with an empty expression vector. The error bars represent the standard deviations from the mean values obtained from three independent experiments performed in duplicate. (C) BRET saturation assays were performed as described for panel A. (D) The activations of the IFN-β promoter and the NF-κB-dependent promoter were determined as described for panel B. (E) Summary table of the relative oligomerization affinities and activations of IFN-β and NF-κB promoters for each MAVS mutant, compared to the levels for wild-type MAVS. (F) MAVS, MAVSΔCARD, MAVSΔ535-540, or MAVSΔTM tagged in N-terminal with FLAG or myc epitopes were cotransfected in 293T cells. After 48 h, cell lysates were immunoprecipitated (IP) with anti-FLAG antibodies, followed by immunoblot analysis (WB) with anti-FLAG (lower panel) and anti-myc (upper panel) antibodies.
FIG. 6.
FIG. 6.
The MAVS TM domain is sufficient to promote oligomerization. (A) C-terminal sequence of TOM22 TM MAVS. The TOM22 sequence is in bold, and the MAVS TM domain is boxed. (B) BRET saturation assays between Rluc-MAVS and eYFP-TOM22 or eYFP-TOM22 TM MAVS were performed as described for Fig. 4A. (C) BRET saturation assays between Rluc-MAVS TM and eYFP-MAVS TM (aa 510 to 540) were performed as described for Fig. 4A.
FIG. 7.
FIG. 7.
Mutagenesis analysis and theoretical three-dimensional model of the monomer and dimer forms of MAVS TM. (A) Sequence of the MAVS TM domain (boxed). Asterisks indicate positions that were mutated to alanine (W517A and Y535A) or tryptophan (Q519W, V520W, A521W, V522W, T523W, G524W, V525W, L526W, V527W, and V528W). (B) Summary table of the relative oligomerization affinities and activations of IFN-β and NF-κB promoters for each MAVS TM mutant, compared to the levels for wild-type MAVS. Affinities were calculated with the BRET50 value obtained from BRET saturation assays for all TM mutants. Important results are colored magenta. The error bars represent the standard deviations from the mean values obtained from three independent experiments performed in duplicate. (C) Similarity of the MAVS TM sequence to the TM α-helix of protein J of the photosystem II reaction center (Protein Data Bank entry 1S5L) (8). The sequences display 25% identity and 85% similarity, with a 20-aa overlap (aa 516 to 535 and 2010 to 2029, respectively). “Structure” represents the secondary structure of the protein J TM segment, deduced from its three-dimensional structure: h, helix; s, bend; t, hydrogen-bonded turn. #, prediction of MAVS TM segment, deduced from various prediction methods. (D) Molecular model of MAVS TM. A ribbon representation including residue side chains and an amino acid van der Waals surface representation are shown on the left and the right, respectively. Residues identified by mutagenesis analysis as essential for MAVS dimer formation are located on one side of the TM α-helix (W517, A521, G524, and V528; colored magenta). Other hydrophobic residues are colored in gray, except Tyr, which is colored in dark yellow. Hydrophilic residues Thr and Gln are colored in green, and Arg is colored in blue. (E) Representative dimer model of MAVS TM. Ribbon representations including the side chains of interfacial residues (W517, V520, A521, G524, V528, and L531) as sticks and the van der Waals surface are shown on the left and the right, respectively. The orientation of the left structure highlights the crossing angle (31°) of the symmetric dimer, while the right structure is rotated 90° to highlight the contacts between interfacial residues. The dimer model was manually positioned within a phospholipid bilayer membrane represented as a simulated model of a 1-palmitoyl-2-oleoyl-3-sn-glycero-3-phospholcholine (POPC) bilayer (obtained from Peter Tieleman; http://moose.bio.ucalgary.ca/). Polar heads and hydrophobic tails of phospholipids (surface structures) are light yellow and gray, respectively. Figures were generated from structure coordinates by using VMD (15) (http://www.ks.uiuc.edu/Research/vmd/) and rendered with POV-Ray (http://www.povray.org/).
FIG. 8.
FIG. 8.
Mitochondrial localization is required for negative regulation of MAVS. (A) Fluorescence confocal microscopy was used to visualize an optical cross-section of live Huh7 cells. Forty-eight hours after transfection with eYFP-MAVS Q519L (green), mitochondria were stained with Mitotracker deep red (red) and nuclei were labeled with Hoechst 33342 (blue). (B) Cell lysates used for panels C and D were immunoblotted with anti-MAVS and anti-GAPDH (glyceraldehyde-3-phosphate dehydrogenase) (loading control) antibodies. (C) 293T cells stably expressing nontarget or MAVS shRNAs were cotransfected with an IFN-β-firefly luciferase reporter and either an empty vector or a vector encoding eYFP-MAVS or eYFP-MAVS Q519L. Sixteen hours after infection with Sendai virus, IFN-β-firefly luciferase reporter activity was measured as described for Fig. 5B. (D) Experiments were performed as described for panel C, but with an NF-κB-firefly luciferase reporter.
FIG. 9.
FIG. 9.
HCV NS3/4A protease activity impairs MAVS oligomerization. 293T cells were cotransfected with Rluc-MAVS or Rluc-MAVS Q519L, eYFP-MAVS, and increasing amounts of expression plasmid encoding HCV NS3/4A protease (50, 100, and 250 ng) in the presence or absence of an HCV protease inhibitor (BILN2061). The BRET1 ratio is expressed in percentage, where 100% is the BRET1 ratio measured in the absence of NS3/4A.

References

    1. Acehan, D., X. Jiang, D. G. Morgan, J. E. Heuser, X. Wang, and C. W. Akey. 2002. Three-dimensional structure of the apoptosome: implications for assembly, procaspase-9 binding, and activation. Mol. Cell 9423-432. - PubMed
    1. Angers, S., A. Salahpour, E. Joly, S. Hilairet, D. Chelsky, M. Dennis, and M. Bouvier. 2000. Detection of beta 2-adrenergic receptor dimerization in living cells using bioluminescence resonance energy transfer (BRET). Proc. Natl. Acad. Sci. USA 973684-3689. - PMC - PubMed
    1. Bastiaens, P. I., I. V. Majoul, P. J. Verveer, H. D. Soling, and T. M. Jovin. 1996. Imaging the intracellular trafficking and state of the AB5 quaternary structure of cholera toxin. EMBO J. 154246-4253. - PMC - PubMed
    1. Bérubé, P., B. Barbeau, R. Cantin, R. P. Sékaly, and M. Tremblay. 1996. Repression of human immunodeficiency virus type 1 long terminal repeat-driven gene expression by binding of the virus to its primary cellular receptor, the CD4 molecule. J. Virol. 704009-4016. - PMC - PubMed
    1. Bigger, C. B., B. Guerra, K. M. Brasky, G. Hubbard, M. R. Beard, B. A. Luxon, S. M. Lemon, and R. E. Lanford. 2004. Intrahepatic gene expression during chronic hepatitis C virus infection in chimpanzees. J. Virol. 7813779-13792. - PMC - PubMed

Publication types

Substances

LinkOut - more resources