. 2008 Nov 26;28(48):12604-13.
doi: 10.1523/JNEUROSCI.2958-08.2008.

Human immunodeficiency virus protein Tat induces synapse loss via a reversible process that is distinct from cell death

Affiliations

Human immunodeficiency virus protein Tat induces synapse loss via a reversible process that is distinct from cell death

Hee Jung Kim et al. J Neurosci. .

Abstract

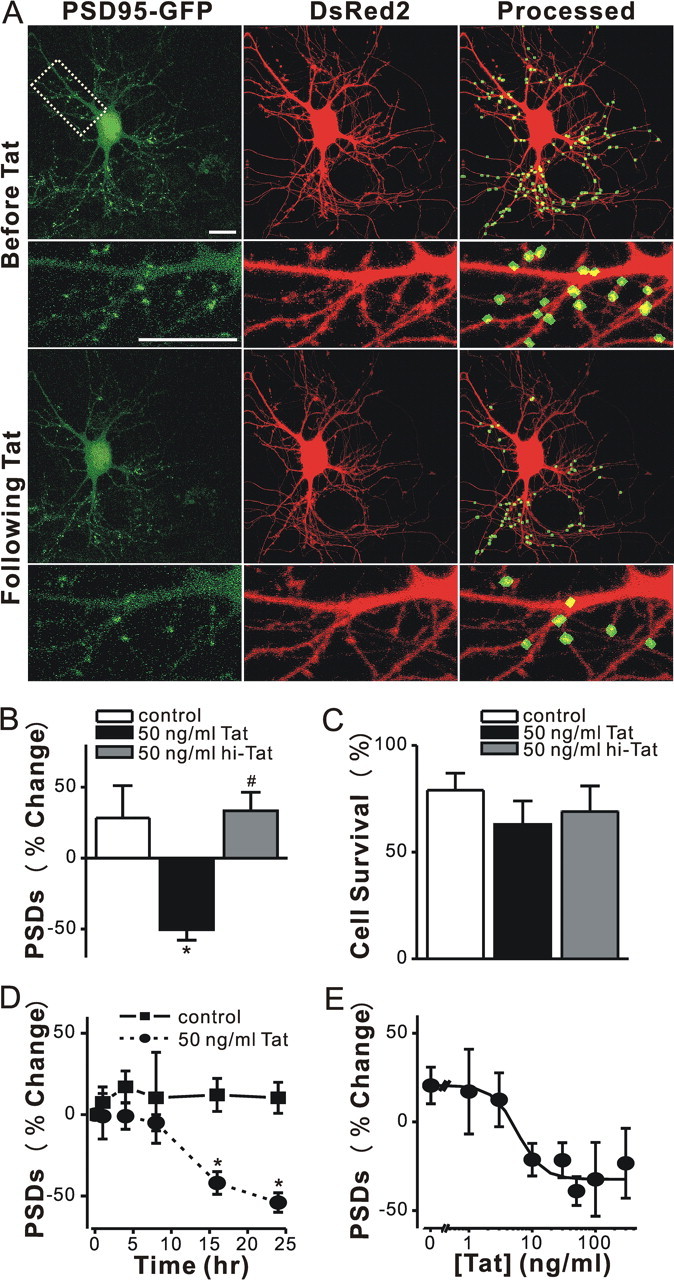
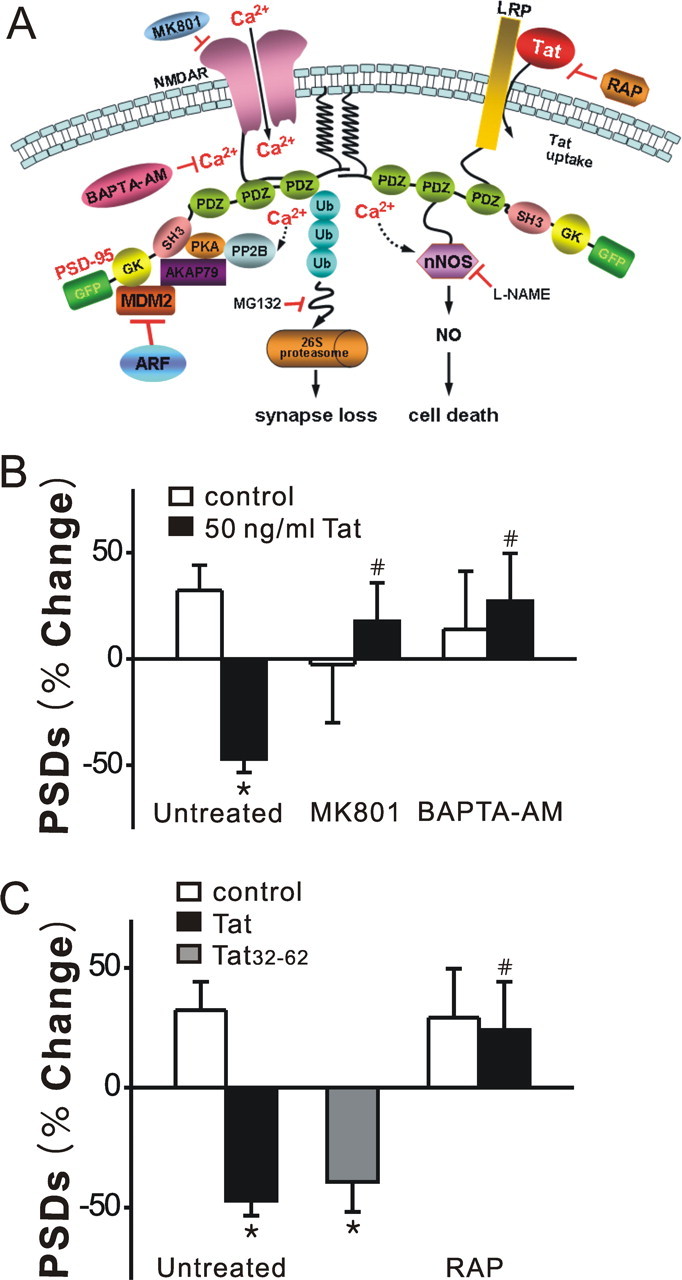
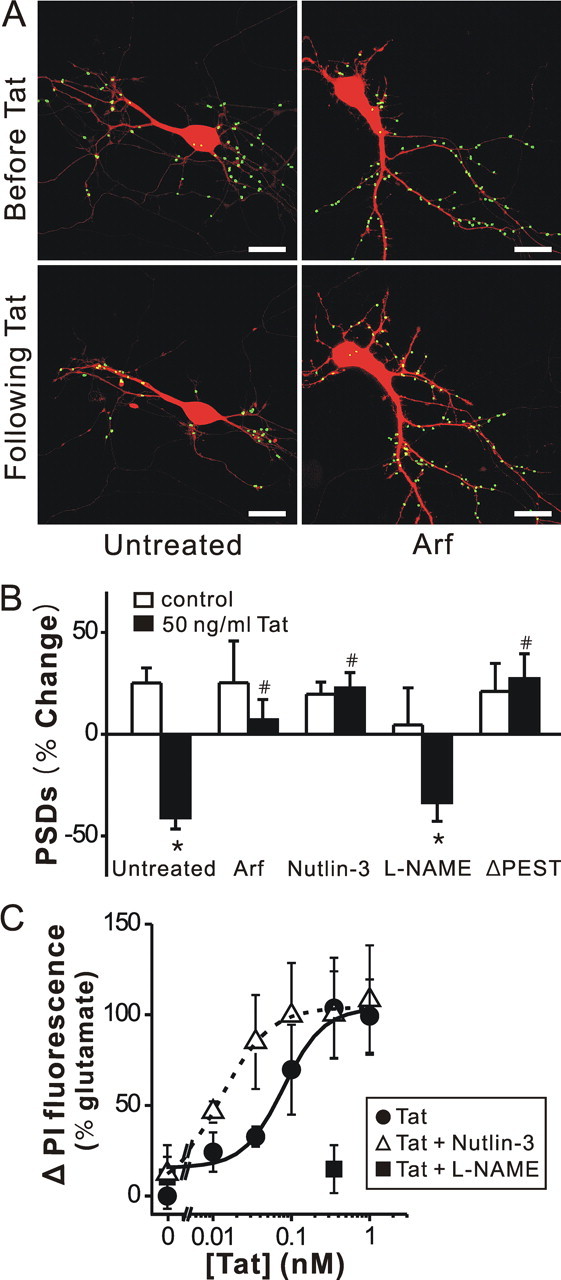
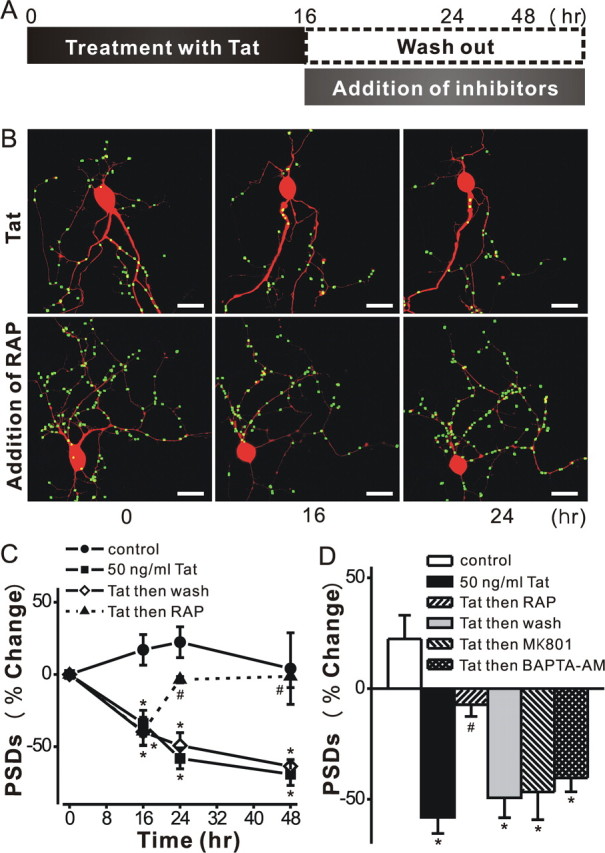
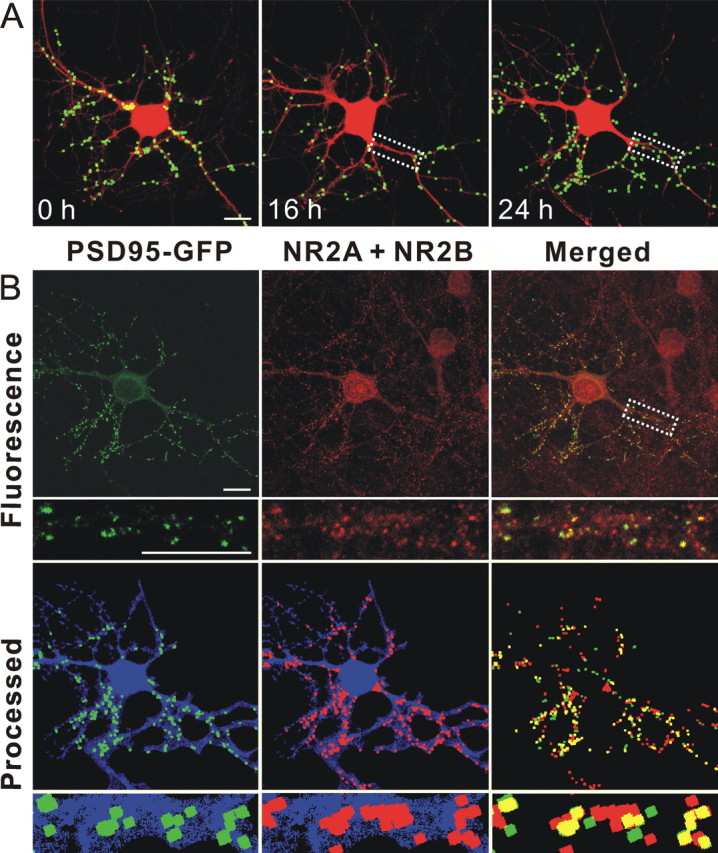
Human immunodeficiency virus (HIV)-1 infection of the CNS produces changes in dendritic morphology that correlate with cognitive decline in patients with HIV-1 associated dementia (HAD). Here, we investigated the effects of HIV-1 transactivator of transcription (Tat), a protein released by virus-infected cells, on synapses between hippocampal neurons using an imaging-based assay that quantified clusters of the scaffolding protein postsynaptic density 95 fused to green fluorescent protein (PSD95-GFP). Tat (24 h) decreased the number of PSD95-GFP puncta by 50 +/- 7%. The decrease was concentration-dependent (EC(50) = 6 +/- 2 ng/ml) and preceded cell death. Tat acted via the low-density lipoprotein receptor-related protein (LRP) because the specific LRP blocker, receptor associated protein (RAP), prevented the Tat-induced decrease in the number of PSD95-GFP puncta. Ca(2+) influx through the NMDA receptor was necessary for Tat-induced synapse loss. Expression of an ubiquitin ligase inhibitor protected synapses, implicating the ubiquitin-proteasome pathway. In contrast to synapse loss, Tat induced cell death (48 h) required activation of nitric oxide synthase. The ubiquitin ligase-inhibitor nutlin-3 prevented synapse loss but not cell death induced by Tat. Thus, the pathways diverged, consistent with the hypothesis that synapse loss is a mechanism to reduce excess excitatory input rather than a symptom of the neuron's demise. Furthermore, application of RAP to cultures treated with Tat for 16 h reversed synapse loss. These results suggest that the impaired network function and decreased neuronal survival produced by Tat involve distinct mechanisms and that pharmacologic targets, such as LRP, might prove useful in restoring function in HAD patients.


Figures

Figure 1.
Figure 1.
HIV-1 Tat induced PSD loss in a time and concentration dependent manner. A, Confocal fluorescent images display maximum z-projections of neurons expressing PSD95–GFP and DsRed2 before and 24 h after treatment with 50 ng/ml Tat. Processing of PSD95–GFP images identified PSDs as fluorescent puncta meeting intensity and size criteria and in contact with a mask derived from the DsRed2 image. Labeled PSDs were dilated and overlaid on the DsRed2 image for visualization purposes (processed). The insets are enlarged images of the boxed region. Scale bar, 10 μm. B, C, Bar graphs summarize the effects of Tat on changes in PSD95–GFP puncta (B, PSDs) and cell viability (C, cell survival) after 24 h treatment under control conditions (control, open bars) or following treatment with 50 ng/ml Tat (solid bars) or 50 ng/ml heat inactivated Tat (hi-Tat, gray bars). Data are mean ± SEM; *p < 0.01 relative to control; # p < 0.01 relative to Tat (ANOVA with Bonferroni post test). D, Graph shows time-dependent changes in the number of PSD95–GFP puncta for untreated cells (control, squares) and cells treated with 50 ng/ml Tat (circles). Data are expressed as mean ± SEM; *p < 0.01 relative to PSDs counted before the addition of Tat (0 h). ANOVA with Bonferroni post test. E, Graph shows concentration-dependent changes in the number PSD95–GFP puncta for cells treated with the indicated concentration of Tat. The mean ± SEM of the net change in PSD95–GFP puncta 24 h after treatment with Tat are plotted for the concentrations indicated (n ≥ 4 for each data point). The curve was fit by a logistic equation of the form percentage PSD change = [(A1 − A2)/(1 + (X/EC50)p)]+A2 where X = Tat concentration, A1 = 21 ± 7% PSD change without Tat, A2 = −32 ± 5% PSD change at a maximally effective Tat concentration and p = slope factor. EC50 was calculated using a nonlinear, least-squares curve fitting program. EC50 and p were 6 ± 2 ng/ml and 2 ± 1, respectively.
Figure 2.
Figure 2.
Tat-induced synapse loss is both NMDA receptor- and LRP-dependent. A, Proposed mechanism of Tat-induced synapse loss and death. B, Inhibition of NMDA receptor-mediated increases in [Ca2+]i prevent Tat-induced synapse loss. Bar graph summarizes the effects of inhibitors on changes in PSD95–GFP puncta (PSDs) after 24 h treatment under control (open bars) or Tat-treated (solid bars) conditions. Cultures were treated with 10 μm MK801 or 100 μm BAPTA-AM for 30 min before addition of Tat. C, The neurotoxic epitotope of Tat induced synapse loss via an LRP-dependent mechanism. HIV-1 BRU Tat amino acids 32–62 (Tat32–62) induced synapse loss. Tat-induced synapse loss was prevented by the LRP inhibitor, RAP (50 nm) applied 15 min before Tat treatment. Data are expressed as mean ± SEM; *p < 0.01 relative to control; # p < 0.01 relative to Tat alone (Untreated) (ANOVA with Bonferroni post test).
Figure 3.
Figure 3.
Tat induced PSD loss via the ubiquitin–proteasome pathway, and Tat induced cell death by activating NOS. A, Processed images acquired before and after 24 h treatment with 50 ng/ml Tat in cells coexpressing ARF display labeled PSDs superimposed on DsRed2 fluorescence. Scale bar, 10 μm. B, Bar graph summarizes the effects of inhibition of the ubiquitin–proteasome pathway and inhibition of nNOS on changes in PSD–GFP puncta (PSDs) after 24 h treatment under control (open bars) or 50 ng/ml Tat-treated (solid bars) conditions. Cells were treated with ARF (expression plasmid cotransfected with DsRed2 and PSD95–GFP), 1 μm nutlin-3 or 100 μm l-NAME as indicated. In cells expressing PSD95ΔPEST-GFP (ΔPEST), Tat did not affect the number of synaptic sites. Data are expressed as mean ± SEM. *p < 0.01 relative to control; # p < 0.01 relative to Tat alone (untreated) (ANOVA with Bonferroni post test). C, Inhibition of an ubiquitin ligase increased and inhibition of NOS decreased, Tat-induced cell death. Cell death was measured using the PI fluorescence assay detailed in Materials and Methods. Cell death was measured after 48 h treatment with the indicated concentrations of Tat in the absence (control, circles) or presence of 1 μm nutlin-3 (open triangles) or 100 μm l-NAME (squares). PI fluorescence was normalized to that measured from cells treated for 48 h with 1 mm glutamate (100%). PI fluorescence from untreated wells was subtracted from each curve (0%). Concentration response curves were generated by fitting a logistic equation to the data using a nonlinear, least-squares curve fitting program (Origin 6.0) and EC50 values calculated. A logistic equation of the form Δ PI Fluorescence = [(A2 − A1)/(1 + (X/EC50)p)]+A1 where X = Tat concentration, A1 = percentage change in PI fluorescence without Tat, A2 = percentage change in PI fluorescence at maximal Tat concentration and p = slope factor. A set of triplicate wells from a single plating of cells was defined as a single experiment (n = 1). All data are presented as mean ± SEM.
Figure 4.
Figure 4.
Tat-induced PSD loss is reversible. A, Schematic shows time line for experiments. B, Representative images display labeled PSDs on neurons expressing PSD95–GFP and DsRed2 before (0 h) and during (16 and 24 h) treatment with 50 ng/ml Tat. The LRP inhibitor RAP (50 nm) was added after 16 h (bottom frames). Note that PSDs lost after 16 h exposure to Tat recovered following treatment with RAP. C, Graph shows significant PSD loss after 16 h exposure to Tat which was sustained for 48 h in the continued presence of Tat (squares) or if Tat was removed after 16 h (open diamonds). PSDs recovered to control (circles) levels following addition of RAP at 16 h (triangles). Data are expressed as mean ± SEM *p < 0.01 relative to control; # p < 0.001 relative to Tat alone for 16 h (ANOVA with Bonferroni post test). D, Bar graph summarizes the net changes in the number of PSD95–GFP puncta (PSDs) 24 h after no treatment (control, open bar) or the addition of Tat (solid bars). The indicated treatments were applied after 16 h exposure to Tat and changes were measure 8 h later (24 h elapsed time). Data are expressed as mean ± SEM. *p < 0.01 relative to control; # p < 0.05 relative to Tat alone for 24 h (ANOVA with Bonferroni post test).
Figure 5.
Figure 5.
PSDs recovered after RAP-induced reversal of Tat-induced synapse loss contain NMDA receptor immunoreactivity. A, Representative images display labeled PSDs on a neuron expressing PSD95–GFP and DsRed2 before (0 h) and during (16 and 24 h) treatment with 50 ng/ml Tat. The LRP inhibitor RAP (50 nm) was added after 16 h. Eight hours after administering RAP, the number of synapses recovered (24 h frame). B, After collecting the live cell image at 24 h (as shown in A 24 h frame) the cells were fixed and labeled with antibodies to DsRed and the NR2A and 2B subunits of the NMDA receptor as described in Materials and Methods. Confocal micrographs display PSD95–GFP fluorescence (green) and NR2A and NR2B (red) immunoreactivity. Merged images display overlapping puncta (yellow). Processed images display puncta within the DsRed2 mask (blue). The same image-processing algorithm described in Materials and Methods was used to identify both NR2 immunoreactive puncta and PSD95–GFP puncta. The insets are enlarged images of the boxed region. Note that NR2A and NR2B immunoreactivity includes nontransfected cells in the field. Scale bar, 10 μm.

References

    1. Adle-Biassette H, Chrétien F, Wingertsmann L, Héry C, Ereau T, Scaravilli F, Tardieu M, Gray F. Neuronal apoptosis does not correlate with dementia in HIV infection but is related to microglial activation and axonal damage. Neuropathol Appl Neurobiol. 1999;25:123–133. - PubMed
    1. Albensi BC. The NMDA receptor/ion channel complex: a drug target for modulating synaptic plasticity and excitotoxicity. Curr Pharm Des. 2007;13:3185–3194. - PubMed
    1. Anderson ER, Gendelman HE, Xiong H. Memantine protects hippocampal neuronal function in murine human immunodeficiency virus type 1 encephalitis. J Neurosci. 2004;24:7194–7198. - PMC - PubMed
    1. Aprea S, Del Valle L, Mameli G, Sawaya BE, Khalili K, Peruzzi F. Tubulin-mediated binding of human immunodeficiency virus-1 Tat to the cytoskeleton causes proteasomal-dependent degradation of microtubule-associated protein 2 and neuronal damage. J Neurosci. 2006;26:4054–4062. - PMC - PubMed
    1. Arnold DB, Clapham DE. Molecular determinants for subcellular localization of PSD-95 with an interacting K+ channel. Neuron. 1999;23:149–157. - PubMed

Publication types

MeSH terms

Substances

LinkOut - more resources