. 2008 Nov 26;28(48):12913-26.
doi: 10.1523/JNEUROSCI.1463-08.2008.

Decoding trajectories from posterior parietal cortex ensembles

Affiliations

Decoding trajectories from posterior parietal cortex ensembles

Grant H Mulliken et al. J Neurosci. .

Abstract

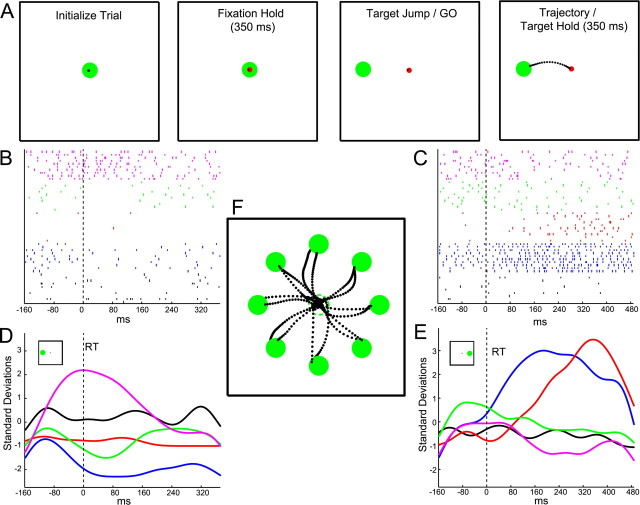
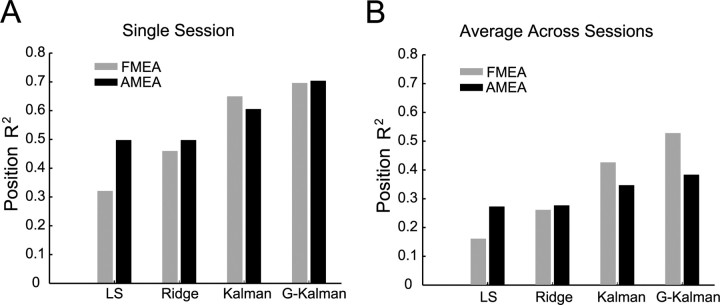
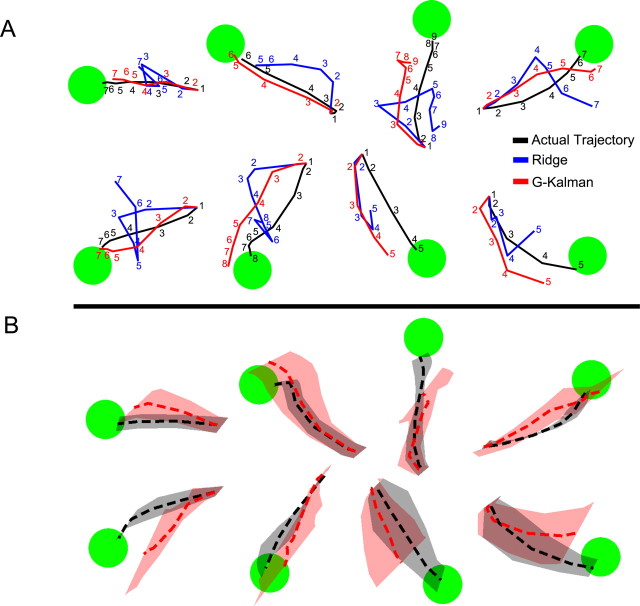
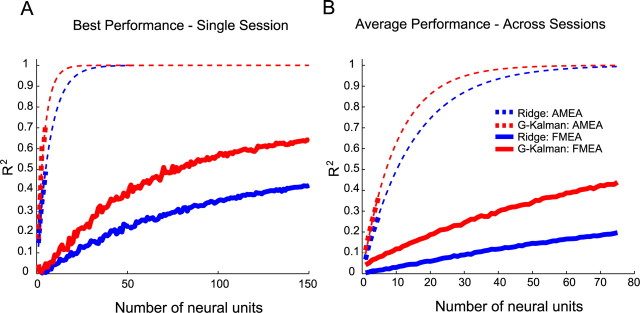
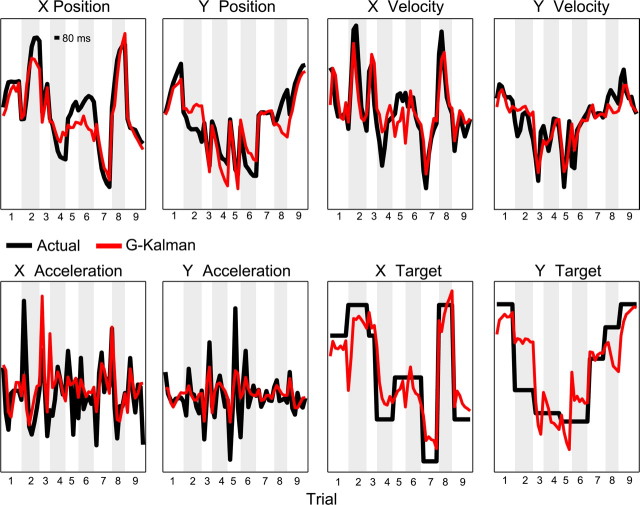
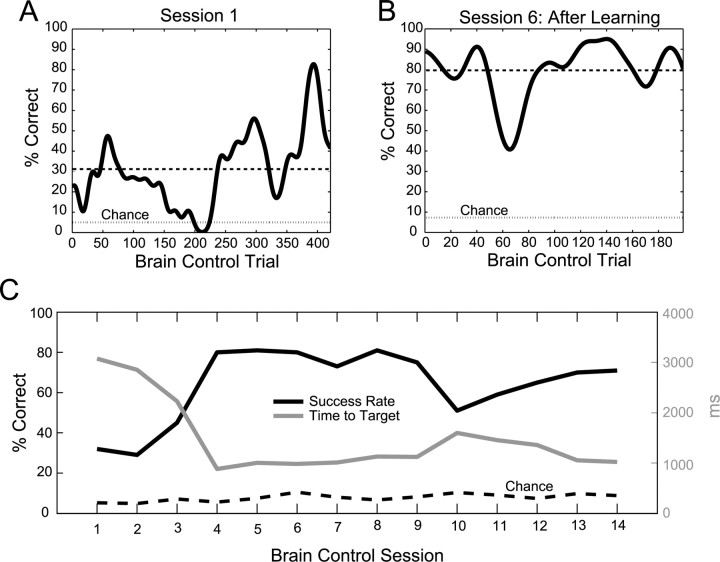
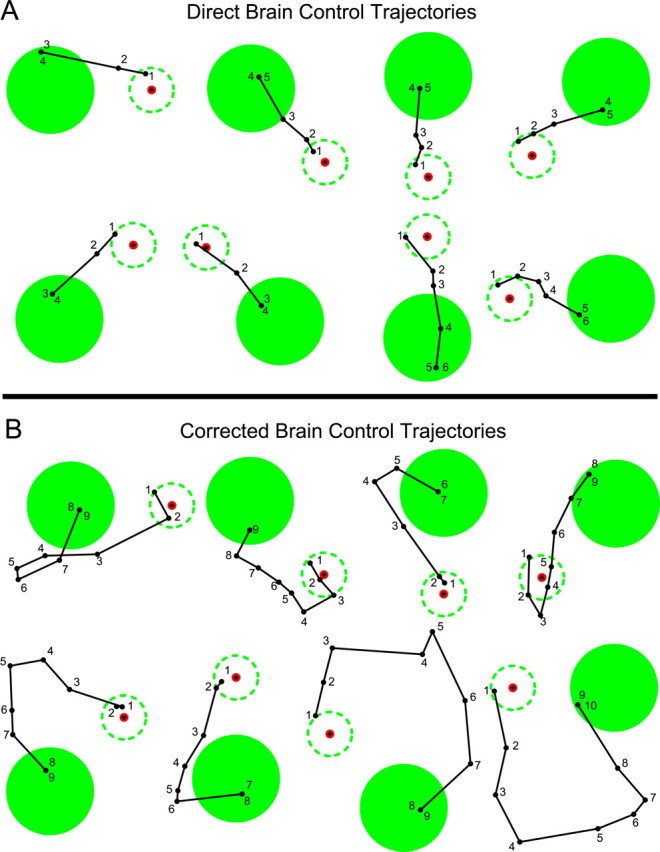
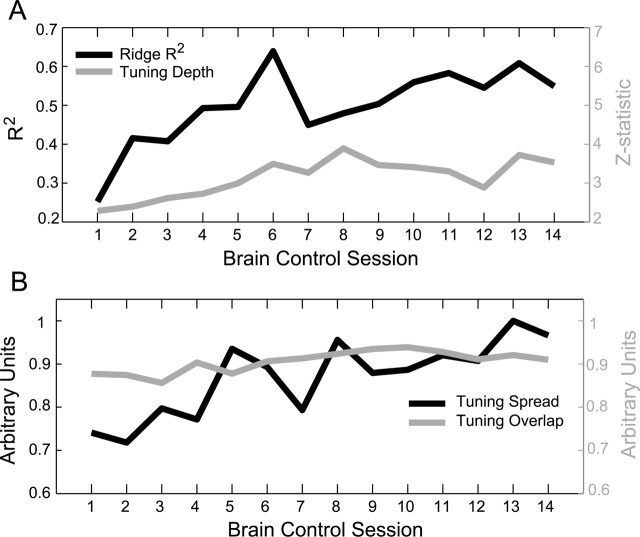
High-level cognitive signals in the posterior parietal cortex (PPC) have previously been used to decode the intended endpoint of a reach, providing the first evidence that PPC can be used for direct control of a neural prosthesis (Musallam et al., 2004). Here we expand on this work by showing that PPC neural activity can be harnessed to estimate not only the endpoint but also to continuously control the trajectory of an end effector. Specifically, we trained two monkeys to use a joystick to guide a cursor on a computer screen to peripheral target locations while maintaining central ocular fixation. We found that we could accurately reconstruct the trajectory of the cursor using a relatively small ensemble of simultaneously recorded PPC neurons. Using a goal-based Kalman filter that incorporates target information into the state-space, we showed that the decoded estimate of cursor position could be significantly improved. Finally, we tested whether we could decode trajectories during closed-loop brain control sessions, in which the real-time position of the cursor was determined solely by a monkey's neural activity in PPC. The monkey learned to perform brain control trajectories at 80% success rate (for 8 targets) after just 4-5 sessions. This improvement in behavioral performance was accompanied by a corresponding enhancement in neural tuning properties (i.e., increased tuning depth and coverage of encoding parameter space) as well as an increase in off-line decoding performance of the PPC ensemble.


Figures

Figure 1.
Figure 1.
Center-out joystick task and example neural recordings obtained using adjustable-depth multielectrode array (AMEA). A, Monkeys initiated each trial by guiding the cursor inside a central green circle. A concentric red circle then appeared, directing the monkeys to fixate centrally for 350 ms. The target was randomly jumped to 1 of 8 (or 12) possible targets, at which point the monkey initiated a trajectory to the peripheral target location. Monkeys held the cursor inside the target for at least 350 ms (100 ms for brain control) before receiving a juice reward. Raster plots show responses of 5 simultaneously recorded neurons during example trajectories to two different target locations, leftward (180°) (B) and rightward (0°) (C). Neural activity is aligned to the time of movement initiation (dashed vertical line) and is plotted up to 80 ms after the cursor entered the target zone. Standardized firing rate time courses for all 5 neurons (sorted by color) are plotted below their respective raster plots for both leftward (D) and rightward (E) target conditions. Note the spatial tuning present for two targets in this ensemble of 5 neurons. Smoothed (Gaussian kernel, SD = 20 ms) firing rate traces were generated for illustrative purposes here, while binned standardized firing rates (80 ms) were in fact used to train decoding algorithms (see Materials and Methods). F, Example trajectories made by monkey 1 for all 8 targets. The dashed green circle is the starting location of the target and is not visible once the target has been jumped to the periphery. Dots represent cursor position sampled at 15 ms intervals along the trajectory.
Figure 2.
Figure 2.
Off-line decoding performance for trajectory reconstruction. A, Single session R2 values for position estimation using the AMEA and fixed-depth multielectrode array (FMEA) techniques. Performances of several models are compared in the bar chart, including least-squares (LS), ridge regression, the Kalman filter, and the goal-based Kalman filter (G-Kalman). B, Average R2 performances for 10 FMEA sessions and 8 AMEA sessions for each of the four models.
Figure 3.
Figure 3.
Representative off-line trajectory reconstructions from single best session. A, Single-trial reconstructions from 8 different test set trials during a single AMEA session. Actual trajectories as well as reconstructions obtained using both ridge regression and the G-Kalman filter are shown for each trial. Numbers along each trajectory indicate the temporal sequence (time steps are labeled every 80 ms) of the cursor's path. Note the visible performance improvement obtained when using the G-Kalman filter compared with ridge regression. B, Average reconstructions for a particular target (dashed red and black traces denote mean G-Kalman prediction and actual trajectory, respectively). Confidence bands denote SDs of X and Y position from the mean position at each time step. Target-specific averages were performed only for trajectories of equal duration (i.e., the mode of the distribution of trajectory durations measured for a particular target). Therefore, these trajectory bands represent a useful visual representation of typical reconstruction performance measured during this AMEA session, but importantly underestimate the actual variability normally present in the full trajectory data set.
Figure 4.
Figure 4.
Neuron-dropping curves comparing AMEA and FMEA decoding efficiencies. A, Recordings from a single session showed significant decoding efficiency (R2/unit) advantages when using the AMEA technique compared with the FMEA approach. B, These decoding efficiency differences were consistently observed when averaged across multiple sessions (8 AMEA, 10 FMEA sessions). It is important to note that extrapolations made for AMEA neuron-dropping curves were performed only for illustrative purposes and should not be considered, and are not used as, as accurate quantitative estimates of R2 for ensemble sizes much larger than 5 neurons. Future AMEA studies will be necessary to collect data to confirm or deny such speculative AMEA projections. Although not shown, this FMEA session reached an R2 of 0.70 at ∼180 neural units when using the G-Kalman filter.
Figure 5.
Figure 5.
Reconstruction of various trajectory parameters using PPC activity. Actual behavior and decoded estimates of position, velocity, acceleration, and target position time series for 9 concatenated trials that were randomly selected from a single AMEA session. All estimates shown were generated using the G-Kalman filter. Alternating gray and white backgrounds denote time periods or different trials. The scale bar in the “X Position” panel depicts 80 ms duration.
Figure 6.
Figure 6.
Brain control performance improvement over multiple sessions. A, Thirty-trial averaged success rate during the first closed-loop, brain control session. Dashed line denotes average success rate for the session, and lighter dashed line denotes the chance level calculated for that session. B, Improved brain control success rate measured during session 6, after learning had occurred. C, After several days, behavioral performance improved significantly. Session-average success rate increased more than twofold and the time needed for the cursor to reach the target decreased by more than twofold.
Figure 7.
Figure 7.
Examples of successful brain control trajectories from monkey 2 during session 8, illustrating trajectories directed toward the target (A) as well as trajectories that initially headed off-course and therefore required online correction (B). Brain control targets were made approximately twice as large as target stimuli presented during the training segment (i.e., during joystick trials) to allow the monkey to perform the task successfully during early brain control sessions. So that behavioral performance and learning effects could be compared fairly across multiple sessions, we kept the target size constant, even after performance had improved.
Figure 8.
Figure 8.
PPC learning effects due to brain control (off-line analyses). A, Off-line decoding performance illustrates that the PPC population was able to increase the amount of information that could be decoded using ridge regression. The tuning properties of the population also showed significant learning trends over 14 brain control sessions. Both the Z-statistic of the tuning depth (A) and the SD of the preferred positions (B) for the ensemble increased significantly over 14 sessions. The average ensemble tuning curve overlap also increased significantly during brain control learning, however to a lesser extent (B).

References

    1. Andersen RA, Buneo CA. Intentional maps in posterior parietal cortex. Annu Rev Neurosci. 2002;25:189–220. - PubMed
    1. Ashe J, Georgopoulos AP. Movement parameters and neural activity in motor cortex and area 5. Cereb Cortex. 1994;4:590–600. - PubMed
    1. Averbeck BB, Chafee MV, Crowe DA, Georgopoulos AP. Parietal representation of hand velocity in a copy task. J Neurophysiol. 2005;93:508–518. - PubMed
    1. Batista AP, Buneo CA, Snyder LH, Andersen RA. Reach plans in eye-centered coordinates. Science. 1999;285:257–260. - PubMed
    1. Branchaud EA, Andersen RA, Burdick JW. An algorithm for autonomous isolation of neurons in extracellular recordings. IEEE/RAS-EMBS International Conference on Biomedical Robotics and Biomechatronics (BioRob); Pisa, Tuscany, Italy. 2006.

Publication types

MeSH terms

LinkOut - more resources