. 2009 Jan;20(2):732-44.
doi: 10.1091/mbc.e08-07-0682. Epub 2008 Nov 26.

Knockdown of p180 eliminates the terminal differentiation of a secretory cell line

Affiliations

Knockdown of p180 eliminates the terminal differentiation of a secretory cell line

Payam Benyamini et al. Mol Biol Cell. 2009 Jan.

Abstract

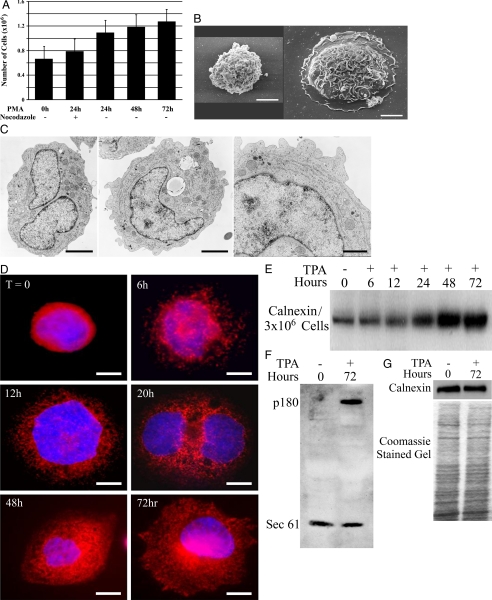
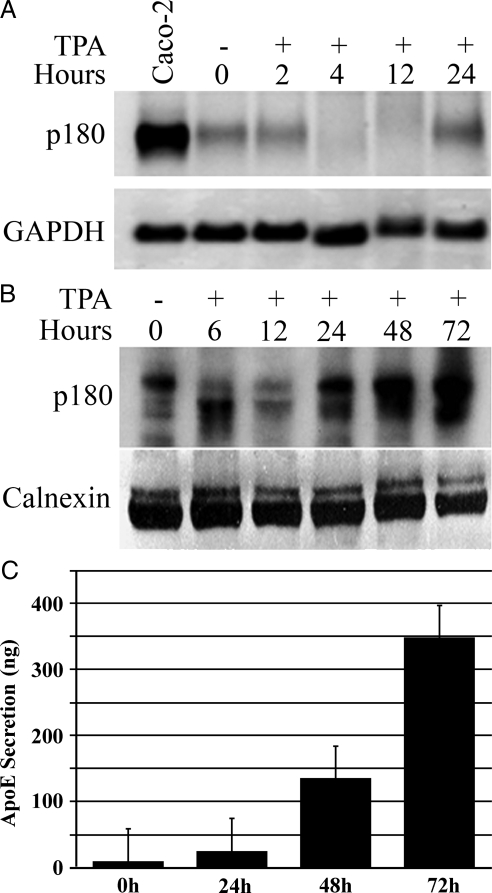
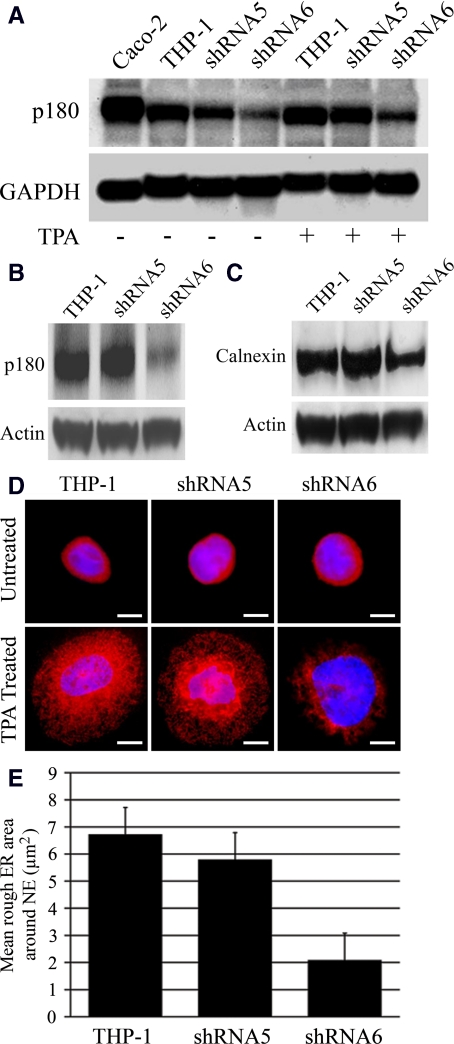
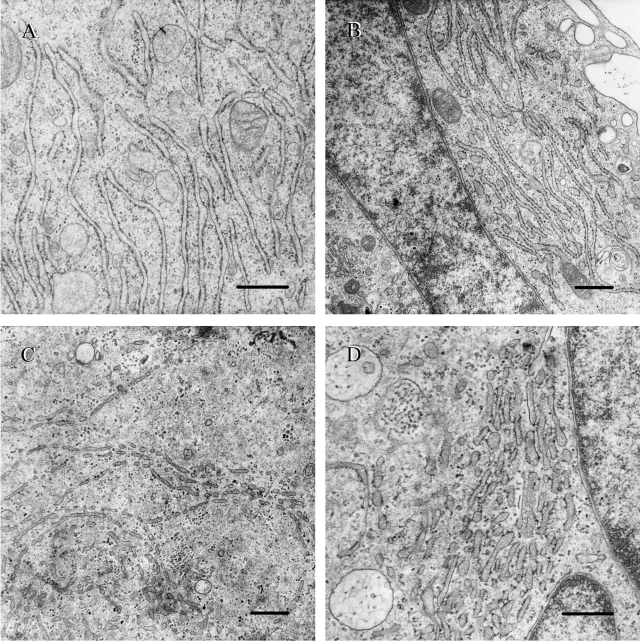
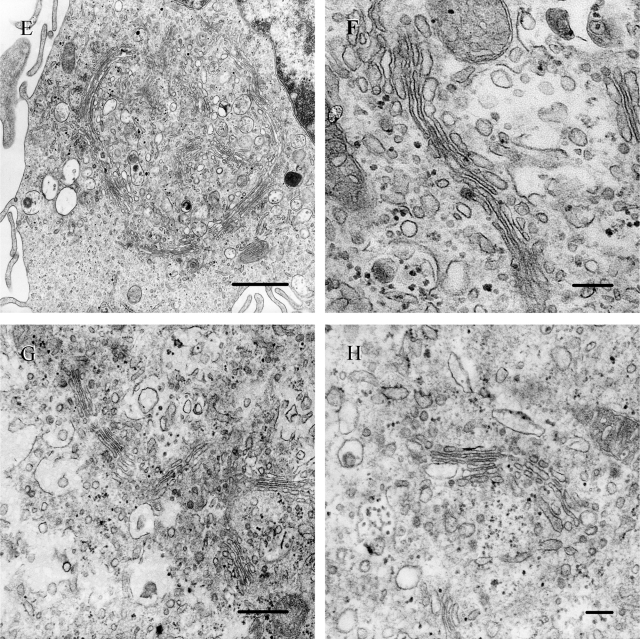
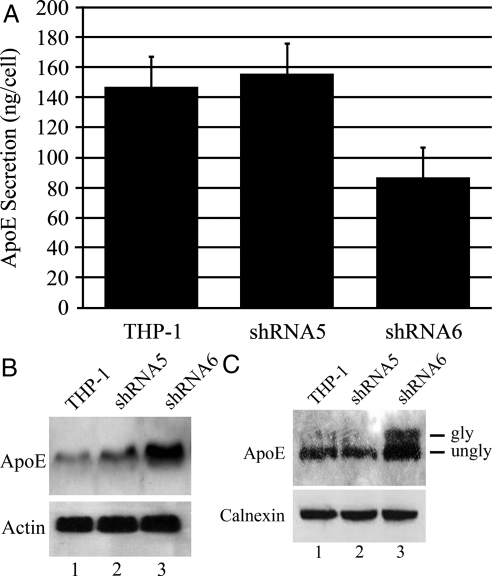
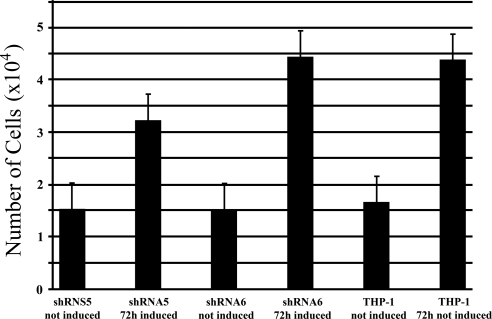
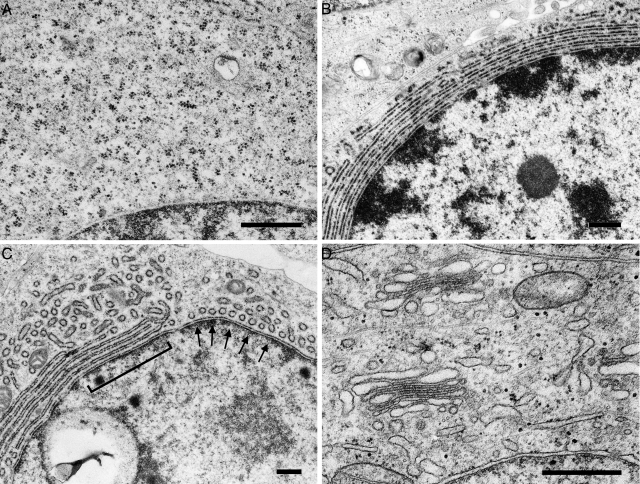
We have previously reported that the expression in yeast of an integral membrane protein (p180) of the endoplasmic reticulum (ER), isolated for its ability to mediate ribosome binding, is capable of inducing new membrane biogenesis and an increase in secretory capacity. To demonstrate that p180 is necessary and sufficient for terminal differentiation and acquisition of a secretory phenotype in mammalian cells, we studied the differentiation of a secretory cell line where p180 levels had been significantly reduced using RNAi technology and by transiently expressing p180 in nonsecretory cells. A human monocytic (THP-1) cell line, that can acquire macrophage-like properties, failed to proliferate rough ER when p180 levels were lowered. The Golgi compartment and the secretion of apolipoprotein E (Apo E) were dramatically affected in cells expressing reduced p180 levels. On the other hand, expression of p180 in a human embryonic kidney nonsecretory cell line (HEK293) showed a significant increase in proliferation of rough ER membranes and Golgi complexes. The results obtained from knockdown and overexpression experiments demonstrate that p180 is both necessary and sufficient to induce a secretory phenotype in mammalian cells. These findings support a central role for p180 in the terminal differentiation of secretory cells and tissues.


Figures

Figure 1.
Figure 1.
TPA treatment of THP-1 cells leads to their terminal differentiation into macrophage like cells. (A) Cell proliferation assay of THP-1 cells after TPA treatment. (B) Scanning electron micrographs of untreated (left) and TPA-treated THP-1 cells (right) at identical magnifications; bar, 5 μm. (C) Transmission electron micrographs of untreated (left panel) and TPA-treated THP-1 cells (middle and right panels); bars = (a and B) 2 μm; (C) 1 μm. (D) A time-course experiment analyzing the rough ER-resident membrane protein, calnexin, during terminal differentiation of THP-1 cells after TPA treatment. Anti-calnexin antibody (red stain) was used to detect the rough ER at before (t = 0) and 6, 12, 20, 48, and 72 h after TPA stimulation. Nucleic acids were detected with DAPI (blue). (E) Western analysis detecting calnexin levels at 0, 6, 12, 24, 48, and 72 h after TPA treatment on a per cell basis. (F and G) Western blot of whole cell lysates, detecting p180 and Sec 61p (F) as well as calnexin (G), on a per milligram protein basis.
Figure 2.
Figure 2.
p180 expression during terminal differentiation of THP-1 cells. (A) Northern blot detecting p180 mRNA levels at 0, 2, 4, 12, and 24 h after TPA treatment. (B) Western blot detecting p180 protein levels in membrane fractions isolated from THP-1 cells at 0, 6, 12, 24, 48, and 72 h after TPA treatment. (C) ELISA quantification of secreted ApoE at 0, 24, 48, and 72 h after TPA treatment.
Figure 3.
Figure 3.
Introduction of shRNA suppresses p180 and ER expression levels in TPA-treated cells. (A) Northern blot detecting p180 mRNA levels in mock-transduced THP-1, shRNA5 (RNAi-transduced control) and shRNA6 cells at 0 and 72 h after TPA treatment. RNA extracted from CaCo2 cells was used as a positive control for p180. (B) Western blot detecting p180 protein levels, from whole cell lysates, in mock-transduced THP-1, shRNA5 (RNAi-transduced control), and shRNA6 cells at 72 h after TPA treatment. (C) Western blot detecting calnexin protein levels, on a per cell basis, at 72 h after TPA treatment. Actin was used as a loading control. (D) Immunofluoresence microscopy of uninduced and 72 h TPA-treated THP-1, shRNA5 (RNAi-transduced control) and shRNA6 cells, respectively. An mAb specific for calnexin was detected with a secondary antibody conjugated to Texas Red. For nucleic acid staining DAPI was used (blue). Bars, 2 μm. (E) Mean area occupied by the ER (calnexin-positive membranes) in cells, estimated by point counting.
Figure 4, A–D.
Figure 4, A–D.
Lowered p180 expression leads to decreased rough ER and Golgi biogenesis. (A and B) Representative electron micrographs of 72 h TPA-treated THP-1 cells, showing elongated rough ER cisternae with bound ribosomes. (C and D) Representative electron micrographs of 72-h TPA-treated shRNA6 cells, showing vesiculated ER membranes virtually devoid of ribosomes.
Figure 4, E–H.
Figure 4, E–H.
(E and F) Representative electron micrographs of TPA-treated shRNA5 (RNAi-transduced control) cells, showing normal, elongated Golgi complexes. (G and H) Electron micrographs of TPA-treated shRNA6 cells, showing shortened and vesiculated Golgi complexes. Scale bars: (A–D and G) 500 nm; (E) 1 μm; (F and H) 200 nm.
Figure 5.
Figure 5.
Reduction of p180 leads to decreased secretion of ApoE. (A) ELISA assay quantifying ApoE secreted into culture from control, shRNA5, and shRNA6 cells at 72 h after TPA treatment. (B) Western blot analysis detecting cellular ApoE levels in the cytosolic fraction. (C) Western blot analysis detecting cellular ApoE levels in membrane fractions.
Figure 6.
Figure 6.
p180-deficient cells continue to proliferate after TPA treatment. Cell proliferation assay comparing shRNA5 and shRNA6 before and 72 h after TPA.
Figure 7.
Figure 7.
Expression of p180 leads to rough ER and Golgi membrane biogenesis. (A) Representative electron micrograph of HEK293 cells transfected with vector control, showing the absence of rough ER and Golgi membranes. (B and C) Representative electron micrographs of HEK293 cells transiently transfected with p180 cDNA, showing elongated ribosome-studded ER cisternae extending from the nucleus to the cells periphery. Arrowheads indicate rough tubules aligned with the NE; bracket points out fused tubules having created rough ER sheets aligned with the NE. (D) Representative electron micrographs of HEK293 cells transiently transfected with p180 cDNA, showing the proliferation of Golgi membranes. Bars, 0.5 μm.

Similar articles

Cited by

References

    1. Ambroziak J., Henry S. A. INO2 and INO4 gene products, positive regulators of phospholipid biosynthesis in Saccharomyces cerevisiae, form a complex that binds to the INO1 promoter. J. Biol. Chem. 1994;269:15344–15349. - PubMed
    1. Anderson D. J., Hetzer M. W. Nuclear envelope formation by chromatin-mediated reorganization of the endoplasmic reticulum. Nat. Cell Biol. 2007;9:1160–1166. - PubMed
    1. Auwerx J. H., Deeb S., Brunzell J. D., Peng R., Chait A. Transcriptional activation of the lipoprotein lipase and apolipoprotein E genes accompanies differentiation in some human macrophage-like cell lines. Biochemistry. 1988;27:2651–2655. - PubMed
    1. Bai J. Z., Leung E., Holloway H., Krissansen G. W. Alternatively spliced forms of the P180 ribosome receptor differ in their ability to induce the proliferation of rough endoplasmic reticulum. Cell Biol. Int. 2007 doi: 10.1016/j.cellbi.2007.10.002. - DOI - PubMed
    1. Basheeruddin K., Rechtoris C., Mazzone T. Transcriptional and post-transcriptional control of apolipoprotein E gene expression in differentiating human monocytes. J. Biol. Chem. 1992;267:1219–1224. - PubMed

Publication types

MeSH terms

Substances

LinkOut - more resources