. 2009 Feb;20(3):809-18.
doi: 10.1091/mbc.e08-03-0313. Epub 2008 Nov 26.

Pil1 controls eisosome biogenesis

Affiliations

Pil1 controls eisosome biogenesis

Karen E Moreira et al. Mol Biol Cell. 2009 Feb.

Abstract

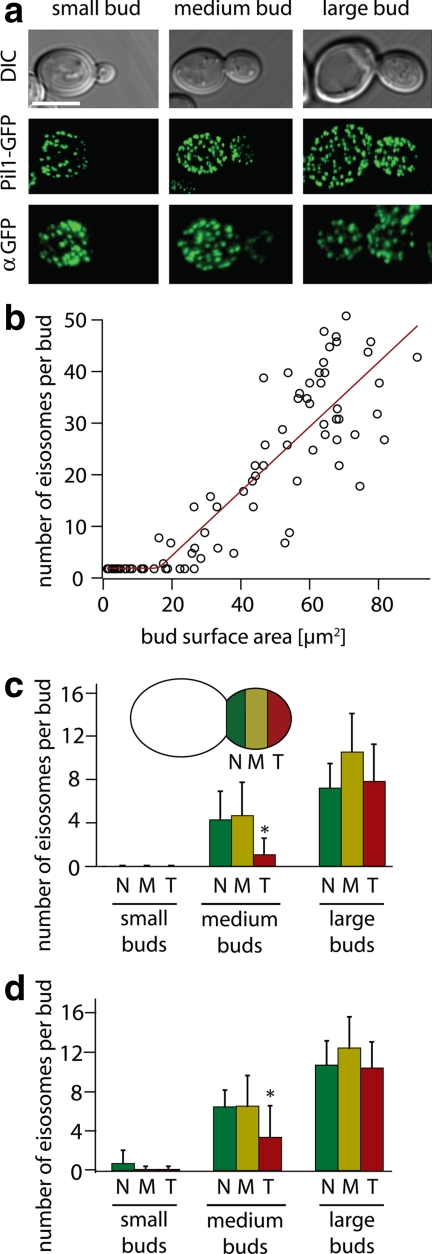
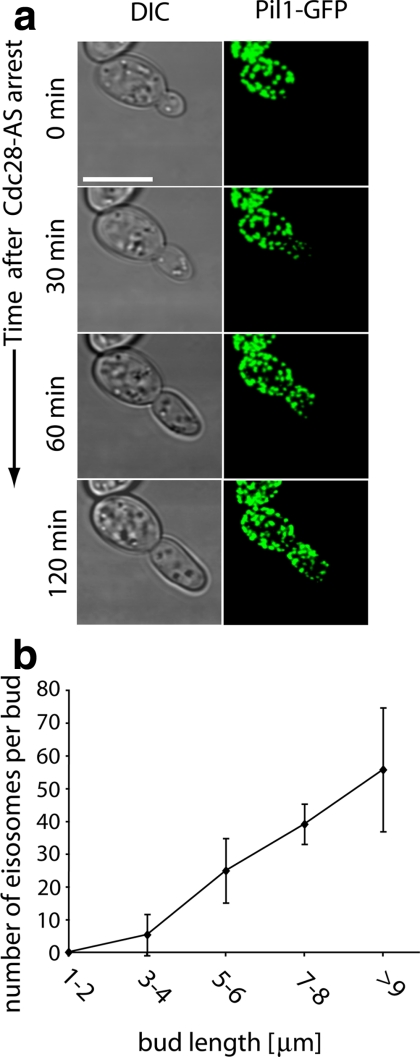
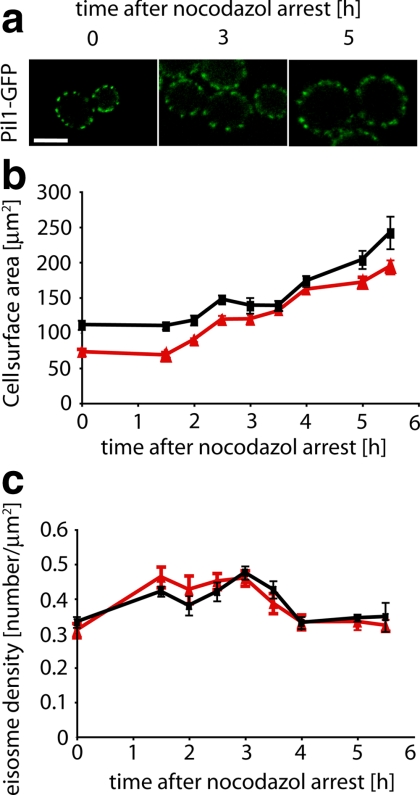
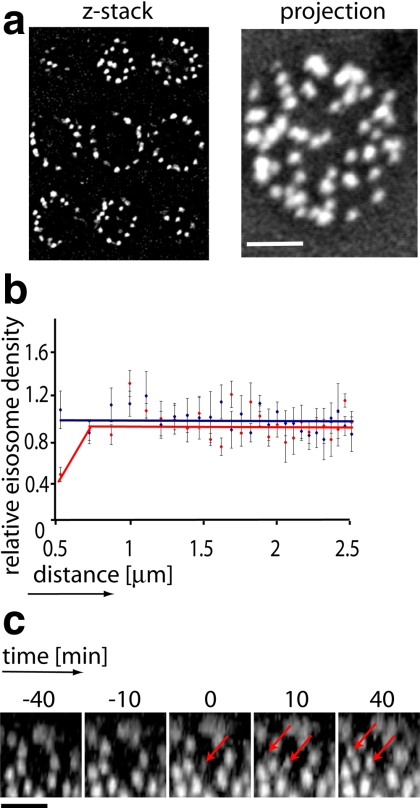
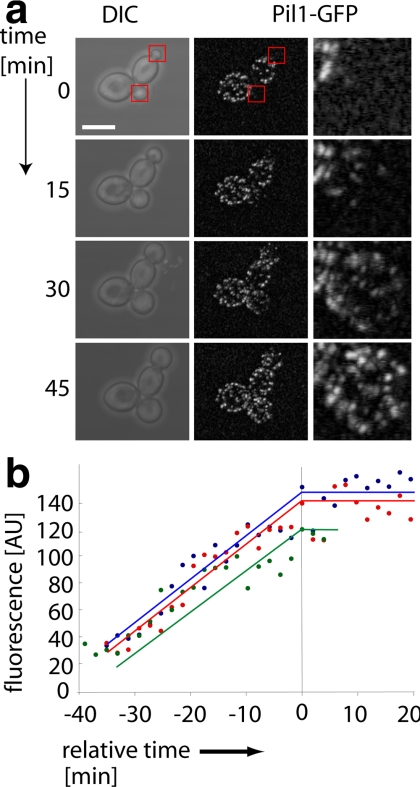
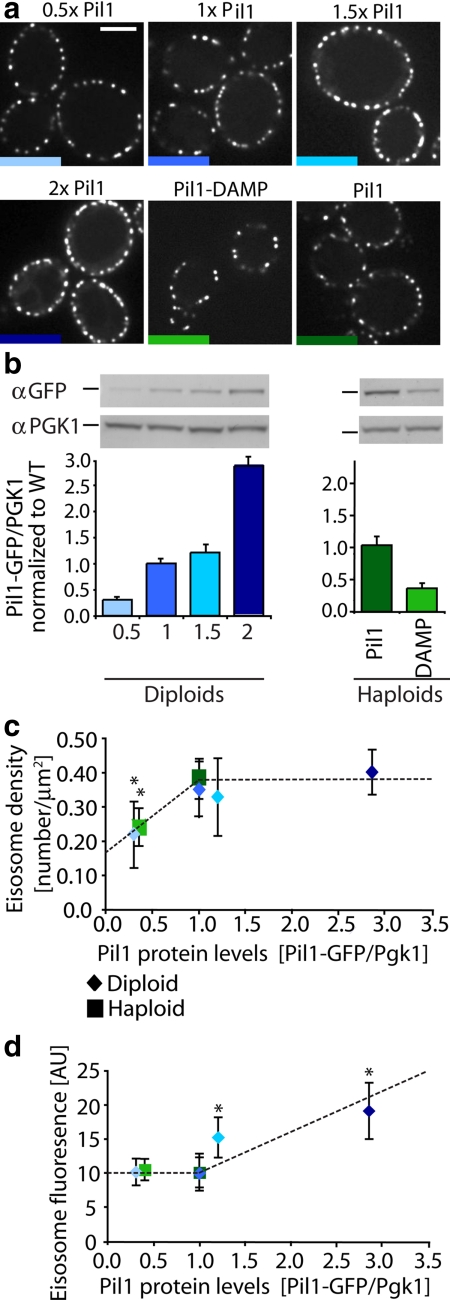
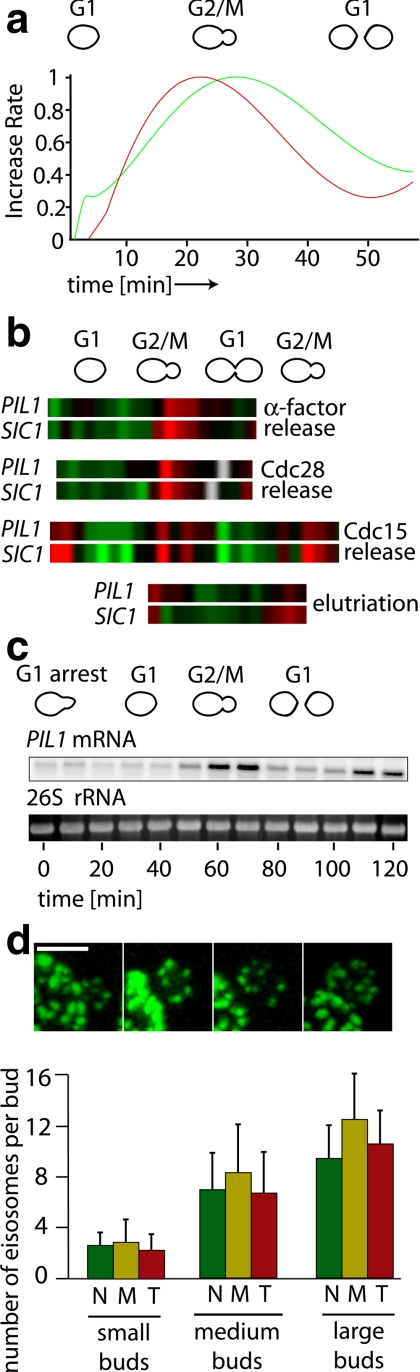
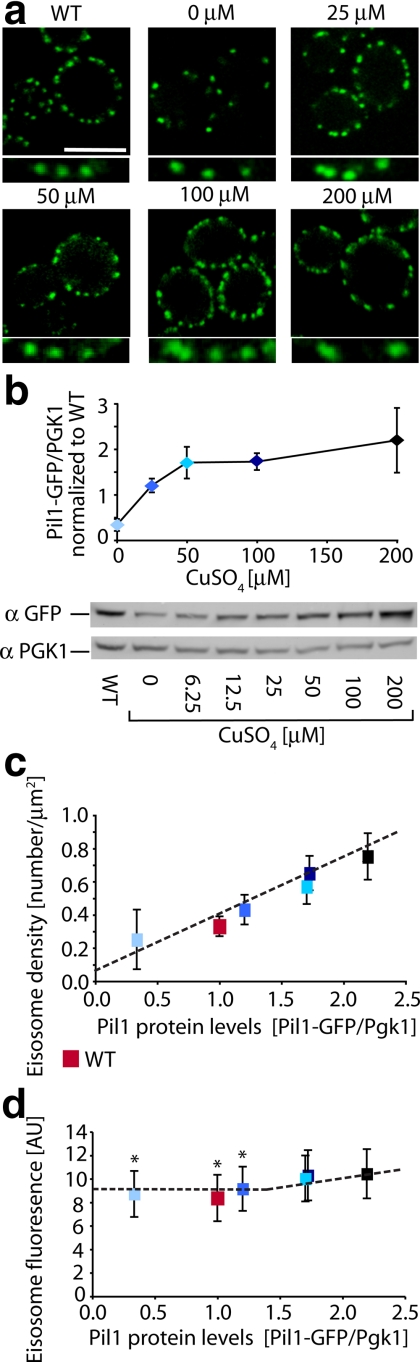
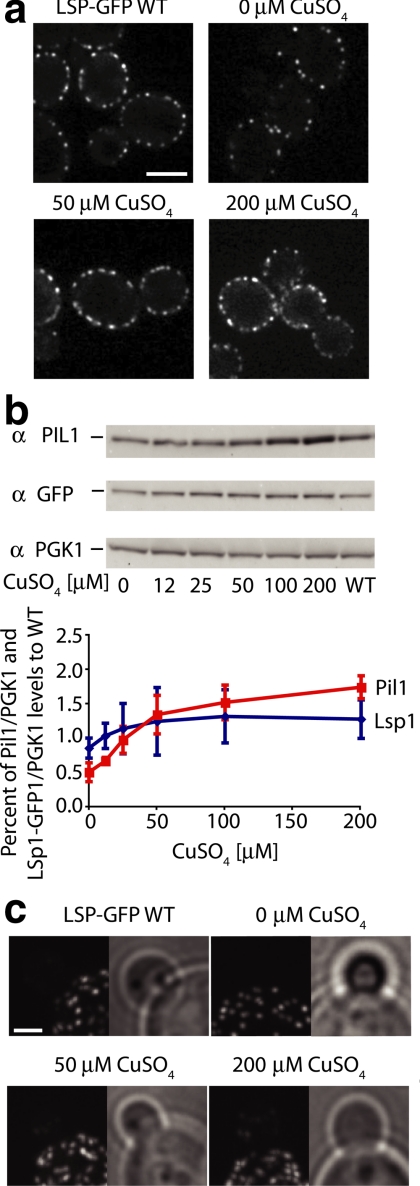
The molecular composition of plasma membranes is constantly remodeled by endocytosis and exocytosis. Eisosomes are large cytoplasmic protein assemblies that localize to specialized domains on the yeast plasma membrane. They are of uniform size and immobile, and their disruption leads to large aberrant plasma membrane invaginations and endocytic defects. It is unknown how eisosomes are formed or inherited and what governs their size, distribution, and location. Here we show that eisosomes are formed de novo in the bud of dividing cells. They colonize newly formed membrane at a fixed density in a polarized wave proceeding from the bud neck to the bud tip and become anchored at the site of their formation. Pil1, one of the two main eisosome subunits, emerges as the central regulator of eisosome biogenesis that determines both size and location of eisosomes. Lowering Pil1 expression leads to normal-sized eisosomes at a reduced density, suggesting that eisosomes must be of a minimal size. Conversely, raising Pil1 expression leads to larger eisosomes at a fixed density, suggesting that under these conditions eisosome nucleation sites are limiting. Pil1 expression is regulated by the cell cycle, which synchronizes eisosome formation with plasma membrane growth. Our results establish a first framework of the molecular principles that define eisosome assembly and distribution.


Figures

Figure 1.
Figure 1.
Eisosomes are assembled de novo. (a) Pil1-GFP accurately reflects the localization of eisosomes. Pil1-GFP fluorescence pictures (top row) are compared with immunofluorescence staining of Pil1-GFP with an antibody against GFP. Scale bar, 5 μm. (b) Eisosomes are formed after an initial lag phase, and their number is directly proportional to cell surface area. Eisosomes were visualized in 3D confocal stacks of cells expressing Pil1-GFP. The number of eisosomes per bud was counted and plotted against the surface area of the bud; n = 83. Eisosome number was fit to a hockey-stick progression using R (http://cran.r-project.org/) according to (Bacon and Watts, 1971). (c) Eisosomes are formed in a polar manner. Confocal stacks of cells with small- (0–17 μm2), medium- (17–60 μm2), and large- (>60 μm2) sized buds were recorded. The buds were segmented along the axis of cell polarity into three equal regions (N, bud neck; M, middle; T, bud tip), and the number of eisosome was counted for each region, n = 95. The number of eisosomes was significantly lower in the T region compared with the N and M regions (ANOVA, *p < 0.001). (d) Similar to panel c, the number of eisosomes was counted for images after immunofluorescence staining of Pil1-GFP with antibody against GFP; n = 43. Similar to panel c, the number of eisosomes was significantly lower in the T region compared with the N and M regions (ANOVA, *p < 0.001). TWY110 was used in all experiments.
Figure 2.
Figure 2.
Eisosome assembly occurs in a polar manner. (a) Cells expressing Pil1-GFP and harboring a drug-sensitized cdc28 allele (KEM100) were incubated with 10 μM of the inhibitor 1NM-PP1 (Bishop et al., 2000) and were followed over time by confocal live-cell microscopy at room temperature. Representative 3D projection images are shown. Scale bar, 5 μm. (b) Quantitation of the eisosome number from experiments described in panel a plotted against bud length along the axis of polarization; n = 75.
Figure 3.
Figure 3.
Eisosome density is constant and regulated to a set point. (a) Cells expressing Pil1-GFP (TWY110) were arrested in M-phase by the addition of 30 μM nocodazole at 30°C and followed over time by confocal life cell microscopy. Representative images are shown. Scale bar, 5 μm. (b) Increase of yeast cell surface area over time after nocodazole arrest in daughter cells (red lines) and mother cells (black lines). (c) Development of eisosome density over time after nocodazole arrest in daughter cells (red lines) and mother cells (black lines). Error bars, SDs from the mean; n = 112.
Figure 4.
Figure 4.
Eisosomes are distributed randomly. High-resolution confocal stacks were acquired for strain TWY110, and representative images are shown in panel a. The coordinates of the centers of all eisosomes of a cell were determined (Supplemental Table S2), and the distribution of the density of eisosomes related to the distance from the center of an eisosome was calculated. Five independent measurements were taken, each with an average of 39 eisosomes. The resulting values were averaged and are shown as a red line in panel b. The blue line shows the result for the same analysis performed on simulated random coordinates. (c) De novo eisosome formation in nocodazole-arrested cells occurs in apparent gaps. Cells (TWY110) were treated as described in Figure 3, and the formation of new eisosomes in the mother cells was followed by confocal live-cell microscopy at room temperature. A representative optical surface section is shown. Arrows indicate the formation of new eisosomes between already existing ones on the mother cell plasma membrane. Scale bars, (a and c) 2 μm.
Figure 5.
Figure 5.
Eisosomes are formed in a continuous process. (a) Formation of eisosomes over a complete cell cycle was followed by confocal time-lapse microscopy of cells expressing Pil1-GFP (TWY110) at room temperature. Representative images are shown. Scale bar, 5 μm. (b) The rate of eisosome formation is constant. The increase of fluorescence of individual eisosomes was quantified over time. The vertical line indicates the time when each eisosome has reached its final fluorescence intensity.
Figure 6.
Figure 6.
Eisosome number and size is controlled by the levels of Pil1. (a) Diploid cells were engineered to express either one (TWY580), two (TWY576), three (TWY581), or four copies (TWY578) of Pil1-GFP, and images were acquired by spinning disk confocal microscopy. Pil1-GFP expression was decreased in haploid cells by expressing a destabilized form of PIL1 mRNA by deletion of the Pil1-GFP mRNA 3′-UTR (Pil1-DAMP, KEM101). Scale bar, 5 μm. (b) Western blot against GFP of diploid cells with increasing copies of Pil1-GFP, and wild-type haploid cells expressing one copy of Pil1-GFP, and against Pgk1, the constitutively expressed 3-phosphoglycerate kinase are shown (top). The graph shows the quantification of Pil1-GFP protein levels relative to Pgk1 and normalized to the wild-type diploid protein level levels (bottom left, blue bars) or to the wild-type haploid protein levels (bottom right, green bars), n = 3. Error bars, SD from the mean. (c) Eisosome density was calculated for cells such as shown in panel a and plotted as a function of Pil1 protein levels, measured by Pil1-GFP/Pgk1 ratios, which are normalized to the wild-type diploid protein levels (blue diamonds) or wild-type haploid protein levels (green squares). ANOVA,* p < 0.0001 for samples with densities lower than wild type. (c) The relative fluorescence intensity was measured and plotted as a function of protein levels as described in panel c. Error bars, the SDs from the mean. Diploid cells (blue diamonds) 0.5, n = 9; 1, n = 16; 1.5, n = 17; 2, n = 22; and haploid cells (green squares) Pil1, n = 17; DAMP, n = 28. Dashed lines represent trend lines.
Figure 7.
Figure 7.
Pil1 expression is cell cycle regulated. TWY110 cells were followed over an entire cell cycle by confocal live-cell imaging. The increase in cell surface over time was calculated from the images, and the total GFP fluorescence per cell was measured. The derivatives of the resulting curve fits indicating rate of change in surface area (red) and rate of change of GFP fluorescence (green) are displayed. The curves show that Pil1-GFP expression correlates with membrane growth. (b) Data mining revealed the strong cell cycle regulation of PIL1 in several different synchronization methods (Spellman et al., 1998). Expression higher than the mean is shown in red and lower than the mean is shown in green. (c) PIL1 mRNA expression is cell cycle controlled. MATa cells (CRY2) were arrested in G1 phase of the cell cycle by addition of α-factor for 1 h and then released. Total RNA from the indicated time points was extracted and analyzed for PIL1 mRNA levels by Northern blotting. The respective cell cycle stage is indicated graphically above the time points. (d) Delay in eisosome deposition is explained by PIL1 cell cycle control. Confocal 3D reconstructions of small buds expressing PIL1 under the CUP1 promoter, KEM102 (top). Eisosomes are present in small buds. Confocal stacks of cells grown in the presence of 25 μM CuSO4 concentration (bottom). Scale bar, 2 μm. Small-, medium-, and large-sized buds were recorded as in Figure 1. The buds were segmented along the axis of cell polarity into three equal regions, and the number of eisosomes was counted for each region; n = 159.
Figure 8.
Figure 8.
Pil1-GFP expression from the CUP1 promoter. (a) Confocal cross sections of cells grown at increasing concentrations of CuSO4 at 30°C for 4 h and KEM102 cells expressing Pil1-GFP driven from the CUP1 promoter are shown. Scale bar, 5 μm. (b) Titration of CuSO4 of cells expressing Pil1-GFP under control of the CUP1 promoter. The original Western blots and the quantification of relative abundance of Pil1-GFP as measured by Pil1-GFP/Pkg1 ratios normalized to wild-type protein levels are shown; n = 3. (c) Eisosome density was measured and plotted as a function of Pil1-GFP protein levels as measured in panel b. (d) Fluorescence intensities of Pil1-GFP in individual eisosomes was measured and plotted against Pil1 protein levels as measured in panel b. Blue squares and diamonds, copper-inducible strain KEM102; red square, wt strain TWY110. Dashed lines represent trend line. ANOVA, *p = 0.147. Error bars, the SD from the mean; n = 56 at each CuSO4 concentration.
Figure 9.
Figure 9.
Pil1 expression from the CUP1 promoter in LSP1-GFP cells. (a) Spinning disk confocal cross sections of cells grown at increasing concentrations of CuSO4 at 30°C for 4 h, expressing Pil1 driven from the CUP1 promoter in LSP1-GFP cells (KEM103) are shown and Lsp1-GFP with Pil1 under its endogenous promoter (Lsp1-GFP wild type, TWY113). Scale bar, 5 μm. (b) Titration of CuSO4 of cells expressing Pil1 under control of the CUP1 promoter. Shown are the original Western blots and the quantitation of relative abundance of Pil1 to Pgk1 and Lsp1-GFP to Pkg1 normalized to wild-type levels of Pil1 and Lsp1-GFP, respectively; n = 3. Error bars, the SD from the mean. WT lane contains extracts from Lsp1-GFP (TWY113) cells with Pil1 under its endogenous promoter. (c) Lsp1 eisosome deposition in small buds does not follow Pil1 deposition. Shown are 3D reconstructions of small buds in cells expressing Lsp1-GFP and Pil1 under its endogenous promoter, TWY113 (left panel, Lsp1-GFP WT) and Lsp1-GFP with Pil1 under the CUP1 promoter, KEM103. Scale bar, 2 μm.

Similar articles

Cited by

References

    1. Bacon D. W., Watts D. G. Estimating the transition between two intersecting straight lines. Biometrika. 1971;58:525–534.
    1. Bagnat M., Simons K. Cell surface polarization during yeast mating. Proc. Natl. Acad. Sci. USA. 2002;99:14183–14188. - PMC - PubMed
    1. Bishop A. C., et al. A chemical switch for inhibitor-sensitive alleles of any protein kinase. Nature. 2000;407:395–401. - PubMed
    1. Brickner J. H., Walter P. Gene recruitment of the activated INO1 locus to the nuclear membrane. PLoS Biol. 2004;2(11):e342. - PMC - PubMed
    1. Broadie K. Synapse scaffolding: intersection of endocytosis and growth. Curr. Biol. 2004;14:R853–R855. - PubMed

Publication types

MeSH terms