. 2008 Dec;154(3):353-9.
doi: 10.1111/j.1365-2249.2008.03810.x.

Increased resistance to CD4+CD25hi regulatory T cell-mediated suppression in patients with type 1 diabetes

Affiliations

Increased resistance to CD4+CD25hi regulatory T cell-mediated suppression in patients with type 1 diabetes

J M Lawson et al. Clin Exp Immunol. 2008 Dec.

Abstract

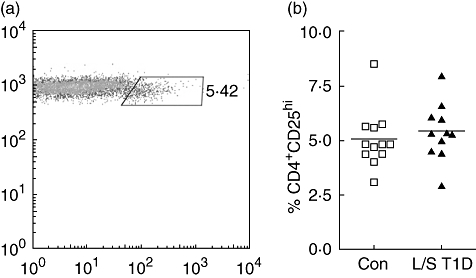
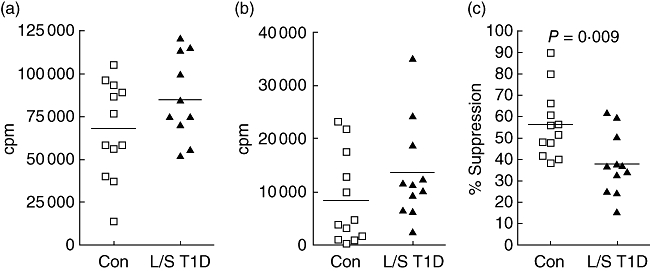
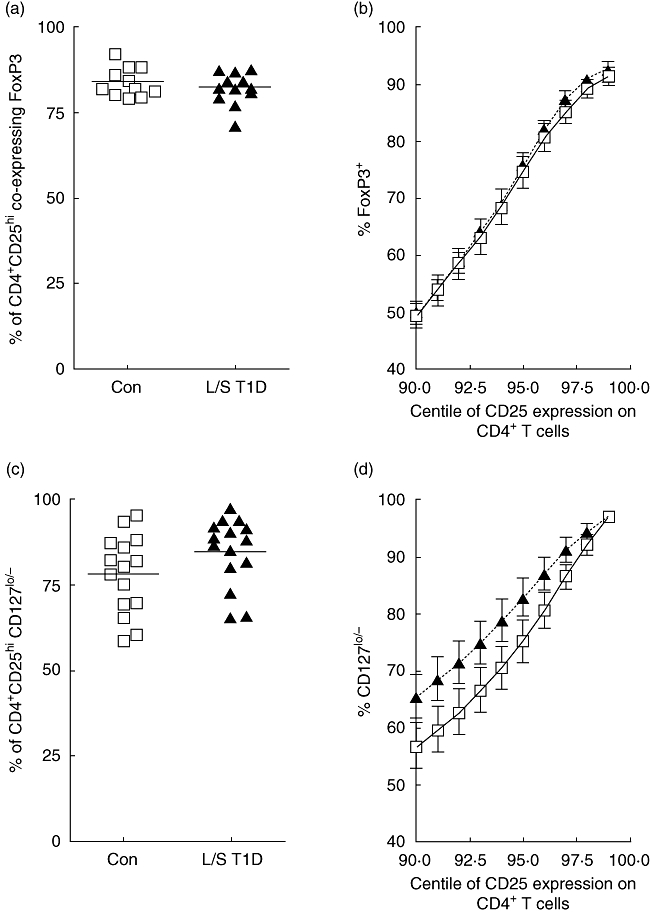
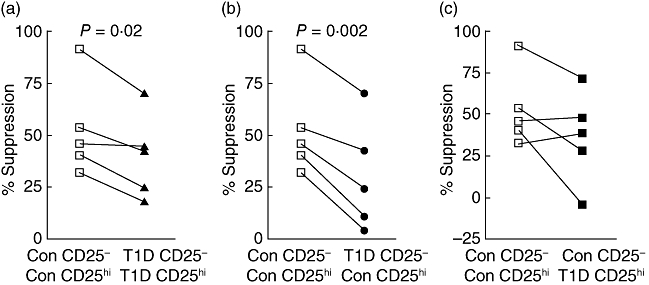
Type I diabetes (T1D) is a T cell-mediated autoimmune disease characterized by loss of tolerance to islet autoantigens, leading to the destruction of insulin-producing beta cells. Peripheral tolerance to self is maintained in health through several regulatory mechanisms, including a population of CD4+CD25hi naturally occurring regulatory T cells (T(regs)), defects in which could contribute to loss of self-tolerance in patients with T1D. We have reported previously that near to T1D onset, patients demonstrate a reduced level of suppression by CD4+CD25hi T(regs) of autologous CD4+CD25- responder cells. Here we demonstrate that this defective regulation is also present in subjects with long-standing T1D (> 3 years duration; P = 0.009). No difference was observed in forkhead box P3 or CD127 expression on CD4+CD25hi T cells in patients with T1D that could account for this loss of suppression. Cross-over co-culture assays demonstrate a relative resistance to CD4+CD25hi T(reg)-mediated suppression within the CD4+CD25- T cells in all patients tested (P = 0.002), while there appears to be heterogeneity in the functional ability of CD4+CD25hi T(regs) from patients. In conclusion, this work demonstrates that defective regulation is a feature of T1D regardless of disease duration and that an impaired ability of responder T cells to be suppressed contributes to this defect.


Figures

Fig. 1
Fig. 1
Isolated populations of CD4-positive cells were stained for expression of CD3, CD4 and CD25 and analysed by flow cytometry. CD25hi T cells were defined as those with a slightly lowered expression of CD4 (a). The percentage of CD4+ T cells in control subjects (squares) and patients with long-standing T1D (triangles) which were CD25hi. Each point represents an individual and mean values are indicated with a horizontal line (b).
Fig. 2
Fig. 2
Proliferation of single cultures of CD4+CD25 (a) and CD4+CD25hi (b) T cells from control subjects (squares) and patients with long-standing T1D (triangles) was assessed by tritiated thymidine incorporation. The percentage suppression of proliferation observed in co-cultures of CD4+CD25 and CD4+CD25hi T cells was calculated (c), P-values were calculated using Student's t-test. Cells were stimulated with 1 µg/ml anti-CD3 and 5 µg/ml anti-CD28 antibodies for 5 days. Each point represents mean counts per minute (cpm) in triplicate wells from one individual. Mean values are indicated with a horizontal line.
Fig. 3
Fig. 3
Peripheral blood mononuclear cells (PBMC) were stained using anti-CD3, anti-CD4, anti-CD25 and anti-forkhead box P3 (FoxP3) or anti-CD127 antibodies and analysed by fluorescence activated cell sorter (FACS). The CD25hi population was defined as those with a lowered expression of CD4 and this population was analysed for expression of FoxP3 or CD127. The percentage of FoxP3+ (a) or CD127lo/− (c) cells in the CD4+CD25hi population was determined in control subjects (squares) and patients with long-standing T1D (triangles). Each point represents one individual and mean values are indicated by a horizontal line. The percent of FoxP3-expressing cells (b) or CD127lo/− cells (d) in the control (squares, solid line) and patient (triangles, dotted line) groups within the top 10% of CD25 expression within the CD4+ T cell compartment is shown. Each point with error bars represents the mean and standard error of the mean of each group.
Fig. 4
Fig. 4
CD4+CD25 and CD4+CD25hi T cells were isolated using magnetic bead technology from paired sets of control subjects and patients with long-standing T1D. Control autologous (open squares; a, b, c) and patients with long-standing T1D autologous (closed triangles; a) co-cultures and cross-over co-cultures of control CD4+CD25hi and patient CD4+CD25 T cells (closed circles; b) and patient CD4+CD25hi and control CD4+CD25 T cells (closed squares; c) were set up. Each set of joined points represents one pair of subjects. P-values were calculated using Student's t test.

References

    1. Castano L, Eisenbarth GS. Type-I diabetes: a chronic autoimmune disease of human, mouse and rat. Annu Rev Immunol. 1990;8:647–79. - PubMed
    1. Di Lorenzo TP, Peakman M, Roep BO. Translational mini-review series on type 1 diabetes: systematic analysis of T cell epitopes in autoimmune diabetes. Clin Exp Immunol. 2007;148:1–16. - PMC - PubMed
    1. Arif S, Tree TI, Astill TP, et al. Autoreactive T cell responses show proinflammatory polarization in diabetes but a regulatory phenotype in health. J Clin Invest. 2004;113:451–63. - PMC - PubMed
    1. Peakman M, Stevens EJ, Lohmann T, et al. Naturally processed and presented epitopes of the islet cell autoantigen IA-2 eluted from HLA-DR4. J Clin Invest. 1999;104:1449–57. - PMC - PubMed
    1. Tree TI, Peakman M. Autoreactive T cells in human type 1 diabetes. Endocrinol Metab Clin North Am. 2004;33:113–33. - PubMed

Publication types

Substances