. 2009 Feb 27;386(3):869-77.
doi: 10.1016/j.jmb.2008.11.005. Epub 2008 Nov 14.

Abeta(1-40) fibril polymorphism implies diverse interaction patterns in amyloid fibrils

Affiliations

Abeta(1-40) fibril polymorphism implies diverse interaction patterns in amyloid fibrils

Jessica Meinhardt et al. J Mol Biol. .

Abstract

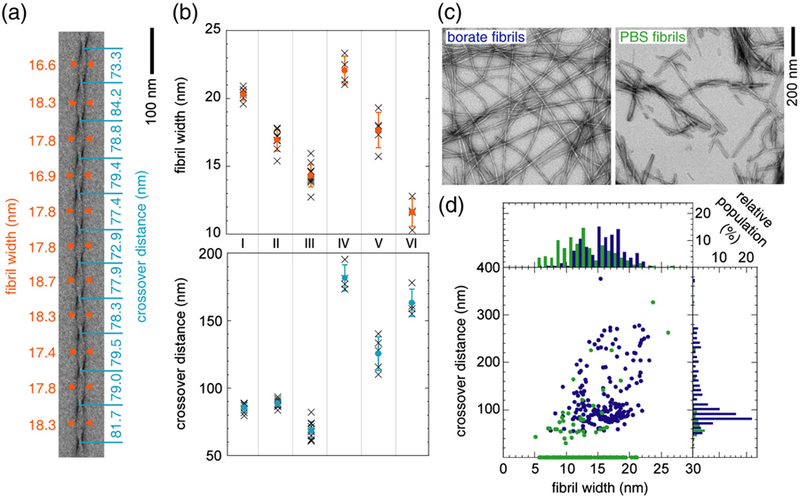
Amyloid fibrils characterize a diverse group of human diseases that includes Alzheimer's disease, Creutzfeldt-Jakob and type II diabetes. Alzheimer's amyloid fibrils consist of amyloid-beta (Abeta) peptide and occur in a range of structurally different fibril morphologies. The structural characteristics of 12 single Abeta(1-40) amyloid fibrils, all formed under the same solution conditions, were determined by electron cryo-microscopy and three-dimensional reconstruction. The majority of analyzed fibrils form a range of morphologies that show almost continuously altering structural properties. The observed fibril polymorphism implies that amyloid formation can lead, for the same polypeptide sequence, to many different patterns of inter- or intra-residue interactions. This property differs significantly from native, monomeric protein folding reactions that produce, for one protein sequence, only one ordered conformation and only one set of inter-residue interactions.


Figures

Figure 1.
Figure 1.
Demonstration of the structural persistence and morphological diversity of Aβ(1–40) fibrils. (a) Example measurement of fibril width and crossover distance at different positions of the same fibril. (b) Plot of fibril width and crossover distance measured for six different fibrils grown in 50 mM borate (pH 7.8) at 22°C. Each column I to VI shows the values measured at different positions of the same fibril (crosses) and their mean with standard deviation (filled circles). (c) Negative staining images of Aβ (1–40) fibrils grown either in 50 mM borate (pH 7.8) at 22°C or in PBS (pH 7.4) at 37°C. (d) Distribution of fibril width (w) and crossover distance (d) of different individual fibrils formed in borate buffer (black) or PBS (gray). Data points with d =0 represent fibrils with no measurable d value (see text for details).
Figure 2.
Figure 2.
Cryo-EM reconstructions of twelve individual Aβ(1–40) fibrils. (a) Electron micrographs of the twelve individual Aβ(1–40) fibrils from the same sample. (b, c) Side (b) and top (c) views of the reconstructed fibrils shown in (a).
Figure 3.
Figure 3.
Resolution assessment using the Fourier shell correlation curve. The Fourier shell correlation curves of the fibril reconstructions indicate the following resolutions at the 0.5 cut-off criterion (dashed line): fibril 1: 33 Å, fibril 2: 34 Å, fibril 3: 30 Å, fibril 4: 33 Å, fibril 5: 33 Å, fibril 6: 36 Å, fibril 7: 39 Å, fibril 8: 33 Å, fibril 9: 32 Å, fibril 10: 30 Å, fibril 11: 24 Å, fibril 12: 26 Å. The curves show several minima that occur at spatial frequencies with poor signal owing to the characteristics of the contrast transfer function of the electron microscope.
Figure 4.
Figure 4.
Comparison of the reconstructed densities with the raw data at different axial rotation angles. (a, b) Projections of both the two-fold symmetrical reconstruction (a) and asymmetrical reconstruction (b) of fibril 11 agree well with the raw images. (c) The two-fold symmetric reconstruction of fibril 12 does not show a good match with the original data. (d) Reconstruction of fibril 12 without this symmetry assumption produces a good agreement with the raw data. In all panels: upper row - projections of the reconstruction; bottom row - raw data.
Figure 5.
Figure 5.
Correlation between crossover distance (d) and polar moment of inertia (Iz). Data taken from Table 1. Filled circles represent fibrils 1–11, open circle represents fibril 12. Only the data points of fibrils 1–11 are fitted with a straight line (R = 0.93).
Figure 6.
Figure 6.
Structural model of the protofilament core topology of fibrils 1, 5 and 11. Top: side view of the fibrils with two protofilament cores modelled into the densities. Bottom: contoured density cross-sections of the fibrils superimposed with two protofilament cores. Each protofilament core comprises a pair of two β-sheet regions colored in yellow (interface) and blue (outside). Each β-sheet region may be formed by one Aβ peptide as suggested by a recent analysis of a morphology corresponding to fibril 11. To date, it is not known whether a β-sheet region consists of a single long strand or whether it is constructed from several short β-sheet segments.

References

    1. Chiti F & Dobson CM (2006). Protein misfolding, functional amyloid, and human disease. Annu. Rev. Biochem 75, 333–366. - PubMed
    1. Fändrich M (2007). On the structural definition of amyloid fibrils and other polypeptide aggregates. Cell. Mol. Life. Sci 64, 2066–2078. - PMC - PubMed
    1. Westermark P, Benson MD, Buxbaum JN, Cohen AS, Frangione B, Ikeda S, et al. (2005). Amyloid: toward terminology clarification. Report from the Nomenclature Committee of the International Society of Amyloidosis. Amyloid 12, 1–4. - PubMed
    1. Finder VH & Glockshuber R (2007). Amyloid-β aggregation. Neurodegener. Dis 4, 13–27. - PubMed
    1. Fändrich M & Dobson CM (2002). The behaviour of polyamino acids reveals an inverse side chain effect in amyloid structure formation. EMBO J 21, 5682–5690. - PMC - PubMed

Publication types

MeSH terms

LinkOut - more resources