. 2009 Jan 2;104(1):79-86.
doi: 10.1161/CIRCRESAHA.108.183475. Epub 2008 Nov 26.

Oxidative-stress-induced afterdepolarizations and calmodulin kinase II signaling

Affiliations

Oxidative-stress-induced afterdepolarizations and calmodulin kinase II signaling

Lai-Hua Xie et al. Circ Res. .

Abstract

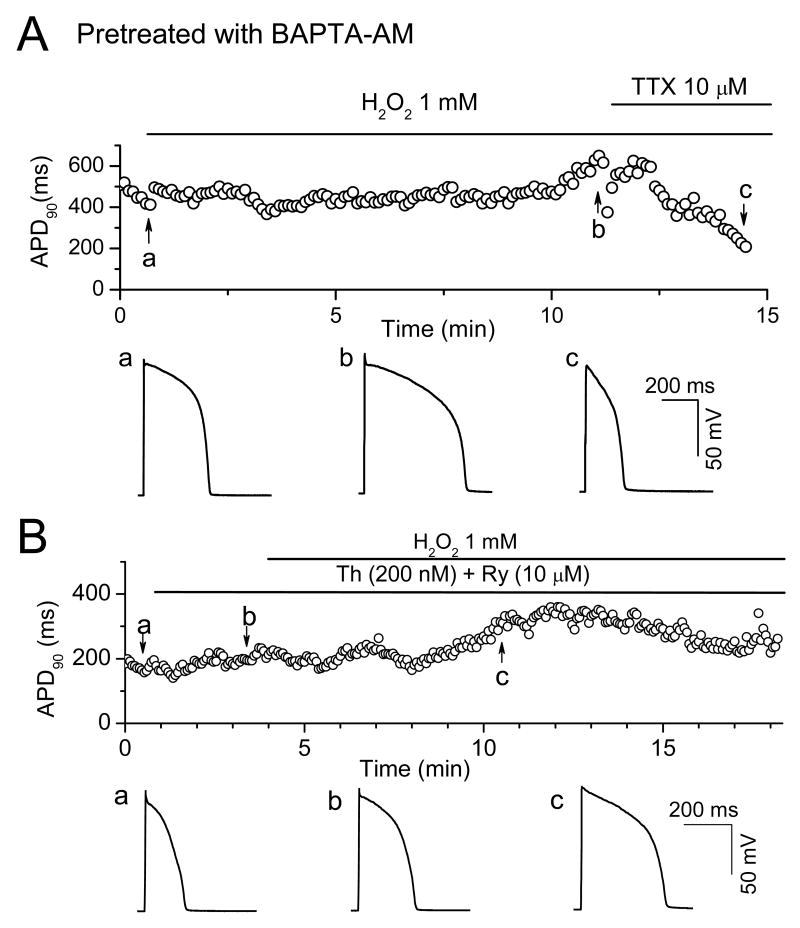
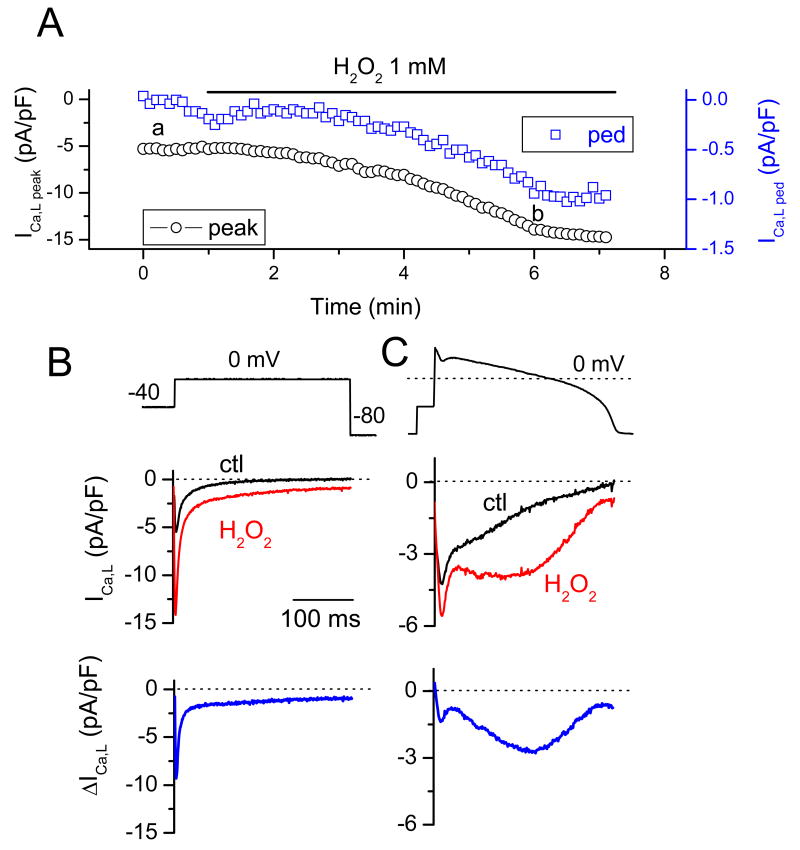
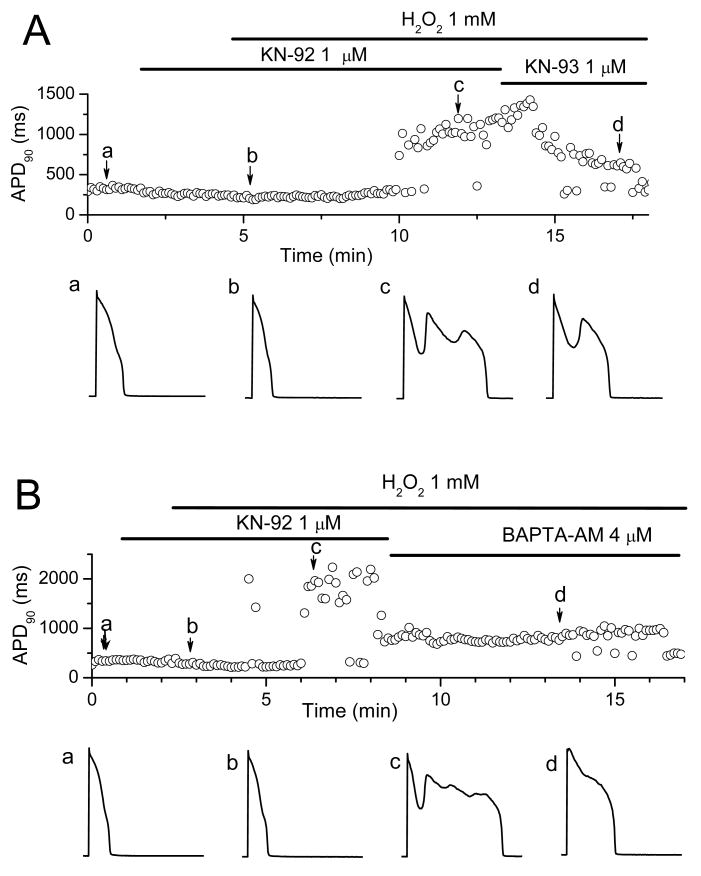
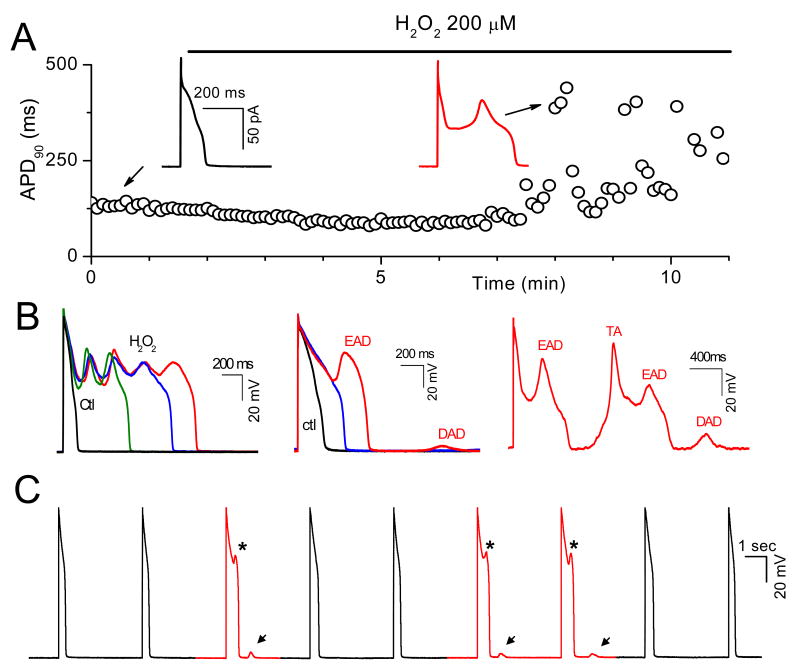
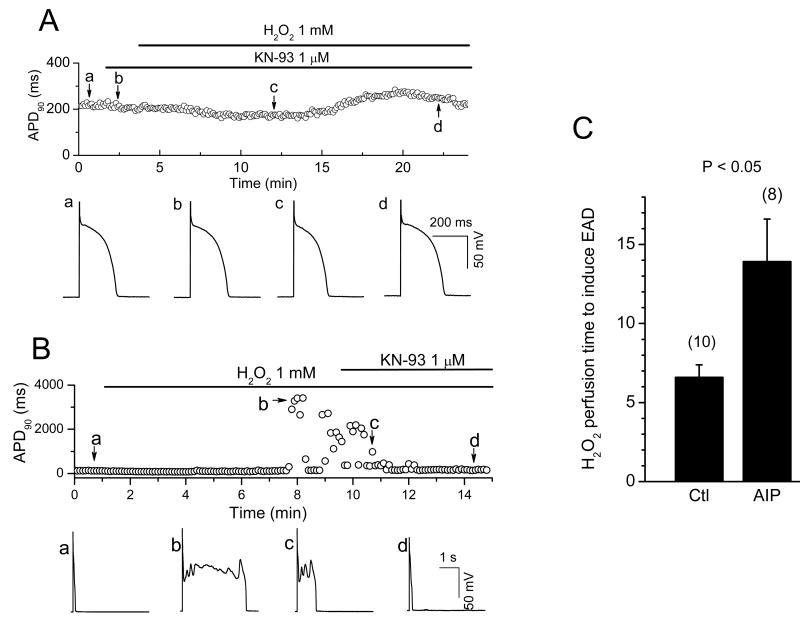
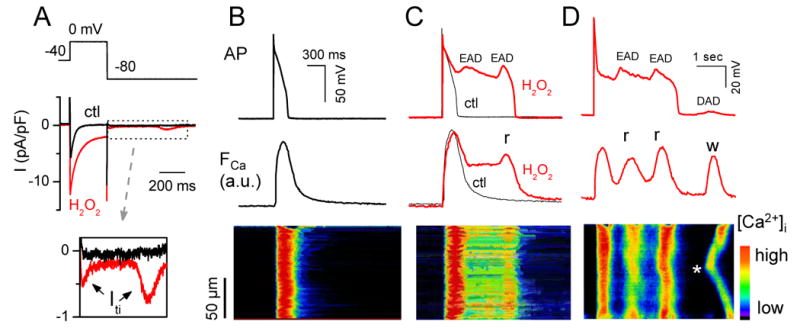
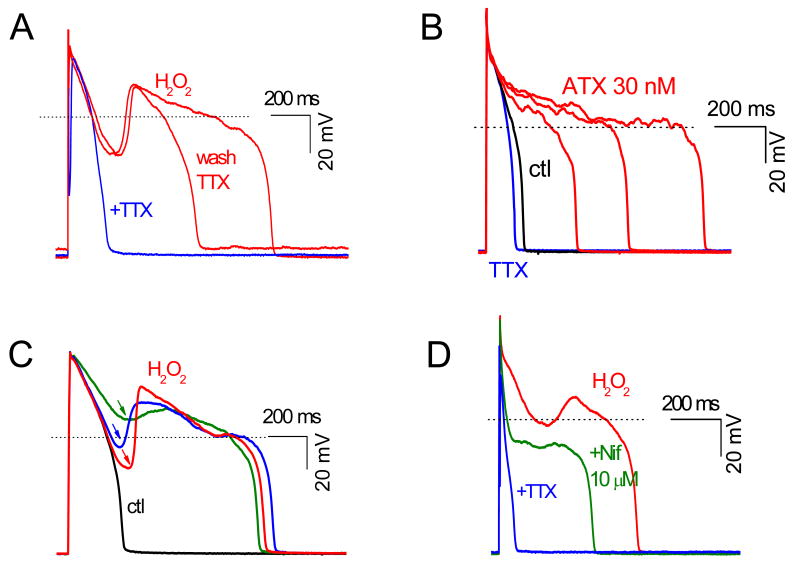
In the heart, oxidative stress caused by exogenous H(2)O(2) has been shown to induce early afterdepolarizations (EADs) and triggered activity by impairing Na current (I(Na)) inactivation. Because H(2)O(2) activates Ca(2+)/calmodulin kinase (CaMK)II, which also impairs I(Na) inactivation and promotes EADs, we hypothesized that CaMKII activation may be an important factor in EADs caused by oxidative stress. Using the patch-clamp and intracellular Ca (Ca(i)) imaging in Fluo-4 AM-loaded rabbit ventricular myocytes, we found that exposure to H(2)O(2) (0.2 to 1 mmol/L) for 5 to 15 minutes consistently induced EADs that were suppressed by the I(Na) blocker tetrodotoxin (10 micromol/L), as well as the I(Ca,L) blocker nifedipine. H(2)O(2) enhanced both peak and late I(Ca,L), consistent with CaMKII-mediated facilitation. By prolonging the action potential plateau and increasing Ca influx via I(Ca,L), H(2)O(2)-induced EADs were also frequently followed by DADs in response to spontaneous (ie, non-I(Ca,L)-gated) sarcoplasmic reticulum Ca release after repolarization. The CaMKII inhibitor KN-93 (1 micromol/L; n=4), but not its inactive analog KN-92 (1 micromol/L, n=5), prevented H(2)O(2)-induced EADs and DADs, and the selective CaMKII peptide inhibitor AIP (autocamtide-2-related inhibitory peptide) (2 micromol/L) significantly delayed their onset. In conclusion, H(2)O(2)-induced afterdepolarizations depend on both impaired I(Na) inactivation to reduce repolarization reserve and enhancement of I(Ca,L) to reverse repolarization, which are both facilitated by CaMKII activation. Our observations support a link between increased oxidative stress, CaMKII activation, and afterdepolarizations as triggers of lethal ventricular arrhythmias in diseased hearts.


Conflict of interest statement

Disclosures: None.

Figures

Fig. 1
Fig. 1. Afterdepolarizations and triggered activity during H2O2 exposure in isolated rabbit ventricular myocytes
A. Action potentials (APs) were elicited with 2 ms-2nA pulses under current clamp conditions at pacing cycle length (PCL) of 6 sec. Values of consecutive APD90 are plotted over time. H2O2 (200 μM) was perfused continuously as indicated by the horizontal bar above the plot. EADs are indicated by the sudden and dramatic increases of APD90 (at ∼ 6 min after H2O2 application). Insets show APs under control condition, and after H2O2 with an EAD. B. Examples of afterdepolarizations and TA during exposure to 1 mM H2O2, including multiple oscillatory EADs (left panel), an EAD followed by a DAD (middle panel), and an EAD followed by a DAD causing TA (right panel). C. Successive APs recorded during H2O2 exposure, illustrating the irregular occurrence of EADs (asterisks) and associated DADs (arrows).
Fig. 2
Fig. 2. The involvement of both INa and ICa,L in H2O2-induced EAD
A. The specific INa blocker TTX (10 μM) reversibly suppressed EADs and shortened APD. B. ATX (30 nM), a selective activator of persistent INa, prolonged APD but did not generate cause frank EADs with a distinct upstroke. C. The amplitude of H2O2-induced EADs depended on their take-off potentials (arrows). D. The ICa,L blocker nifedipine (Nif, 10 μM) suppressed the EAD upstroke, although AP plateau remained prolonged, unless TTX (10 μM) was also added.
Fig. 3
Fig. 3. Enhancement of ICa,L by H2O2
A. Time course of the peak and residual pedestal (ped) ICa,L during a 300 ms voltage clamp pulse to 0 mV (voltage protocol shown in B). B. Voltage clamp pulse (above) and superimposed current traces showing ICa,L before (black) and ∼5 min after perfusion of 1mM H2O2 (red). The difference current is shown in the bottom trace. C. Same as B, but with an AP clamp waveform replacing the square voltage clamp pulse.
Fig. 4
Fig. 4. Transient inward current (Iti) and Cai transients during H2O2–induced EADs and DADs
A. Similar to Fig. 3B, but with an Iti following repolarization to -80 mV in the presence of H2O2 (expanded in bottom trace). B. AP (top), simultaneous whole-cell Cai transient (middle), and a line-scan image along the long axis of the myocyte (bottom) before H2O2. C & D. Same following H2O2 exposure. In C, two EADs occur, leading to persistent elevation in Cai and additional Ca2+ release (r) during the second EAD. In D (different cell), two EADs (associated with additional ICa,L-gated SR Ca2+-release) are followed by a DAD due to a non-voltage gated spontaneous Cai wave (w) starting from the middle of the cell (*).
Fig. 5
Fig. 5. Dependence of H2O2-induced EADs on intact Cai cycling
A. Time course of APD90 in a myocyte preloaded with BAPTA-AM (4 μM) for 30 min exposure to 1 mM H2O2. Representative APs at points a (control), b (∼10 min in H2O2), and c (H2O2 + TTX) are shown below. B. Same, but in a myocyte pre-treated with 10 μM Ryanodine (Ry) + 200 nM Thapsigargin (Th) prior to H2O2.
Fig. 6
Fig. 6. Suppression of H2O2–induced EADs by the CaMKII inhibitor KN-93 and AIP
A. Time course of APD90 in a myocyte treated with the CaMKII inhibitor KN-93 prior to exposure to 1 mM H2O2. APs under control (a), in the presence of KN-93 and after perfusion with KN93 + H2O2 for 9 min (c) and 19 min (d) are shown in the lower panels. B. Same, but with KN-93 applied after EADs were induced by H2O2. In both protocols, KN-93 suppressed EADs. C. Bar graph showing the average H2O2 (200 μM) perfusion time to cause EAD appearance in the absence and presence of 2 μM AIP.
Fig. 7
Fig. 7. Failure of KN-92, an inactive analog of KN-93, to prevent H2O2–induced EADs
A. Same protocol as in Fig. 6A, but with KN-92 initially in place of KN-93. KN-92 failed to prevent EADs during exposure to 1 mM H2O2, which were subsequently partially suppressed by KN-93. APs at points a (control), b (∼ 2 min after KN-92), c (KN-92 + H2O2) and d (KN-93 + H2O2) are shown below. B. Same as A, but applying BAPTA-AM to suppress EADs after KN-92 + H2O2.

References

    1. Lakatta EG, Sollott SJ. The “heartbreak” of older age. Mol Interv. 2002;2:431–446. - PubMed
    1. Slezak J, Tribulova N, Pristacova J, Uhrik B, Thomas T, Khaper N, Kaul N, Singal PK. Hydrogen peroxide changes in ischemic and reperfused heart. Cytochemistry and biochemical and X-ray microanalysis. Am J Pathol. 1995;147:772–781. - PMC - PubMed
    1. Corretti MC, Koretsune Y, Kusuoka H, Chacko VP, Zweier JL, Marban E. Glycolytic inhibition and calcium overload as consequences of exogenously generated free radicals in rabbit hearts. J Clin Invest. 1991;88:1014–1025. - PMC - PubMed
    1. Ward CA, Giles WR. Ionic mechanism of the effects of hydrogen peroxide in rat ventricular myocytes. J Physiol. 1997;500:631–642. - PMC - PubMed
    1. Song Y, Shryock JC, Wagner S, Maier LS, Belardinelli L. Blocking late sodium current reduces hydrogen peroxide-induced arrhythmogenic activity and contractile dysfunction. J Pharmacol Exp Ther. 2006;318:214–222. - PubMed

Publication types

MeSH terms