Clinical Trial
. 2009 Feb;155(2):156-65.
doi: 10.1111/j.1365-2249.2008.03814.x. Epub 2008 Nov 20.

Proinsulin peptide immunotherapy in type 1 diabetes: report of a first-in-man Phase I safety study

Affiliations
Clinical Trial

Proinsulin peptide immunotherapy in type 1 diabetes: report of a first-in-man Phase I safety study

S L Thrower et al. Clin Exp Immunol. 2009 Feb.

Abstract

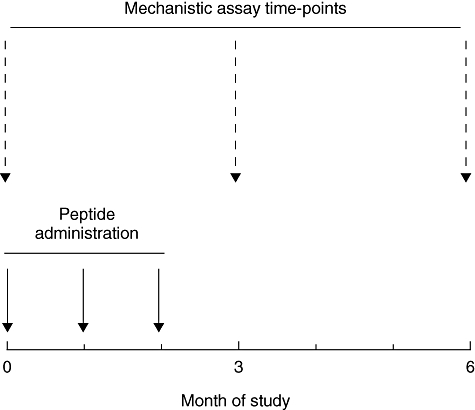
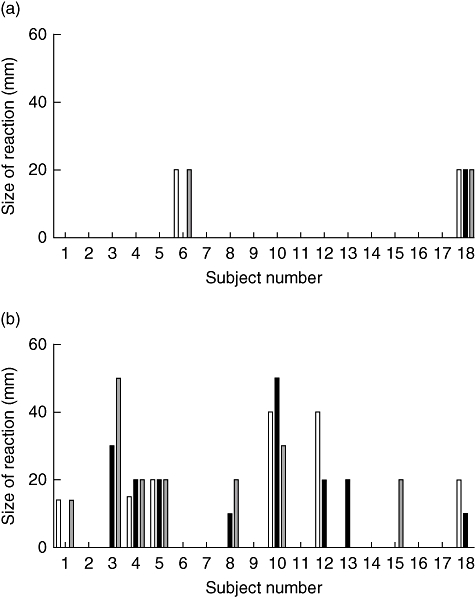
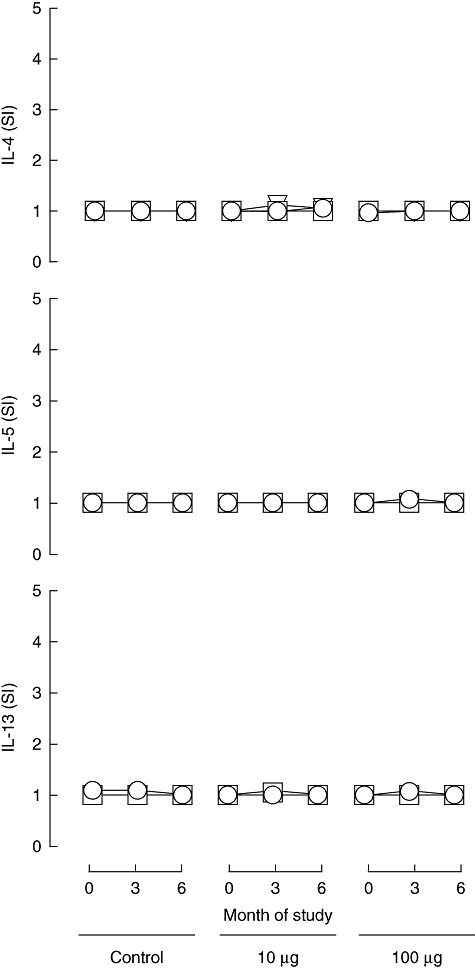
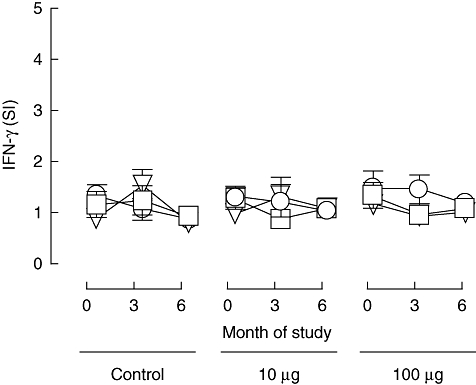
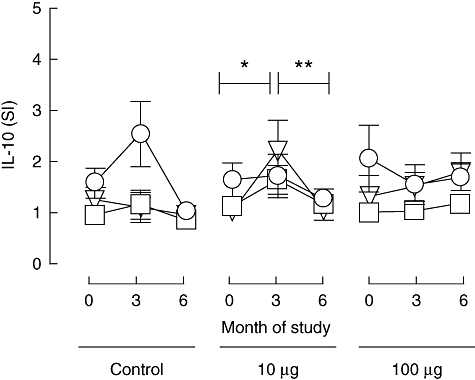
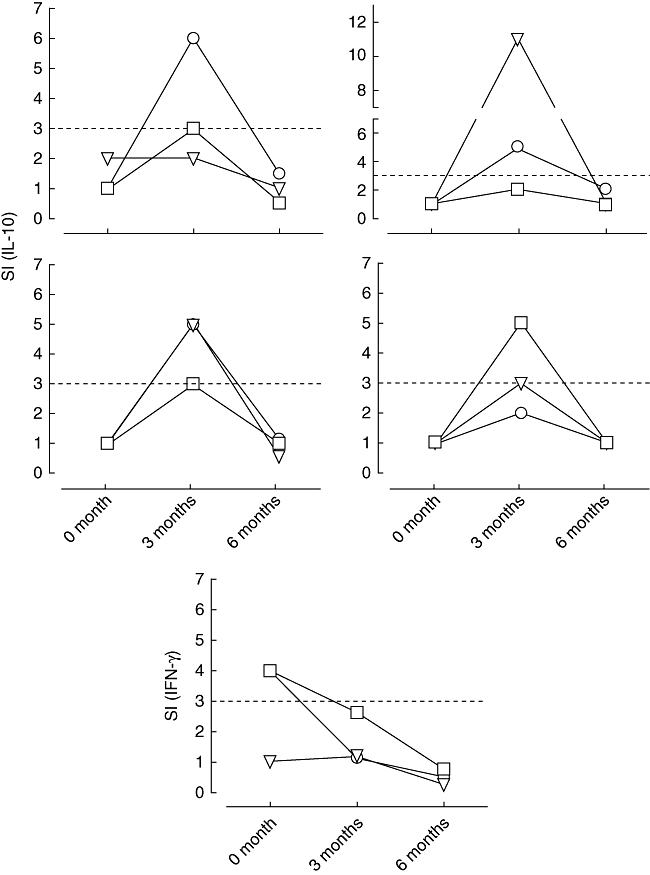
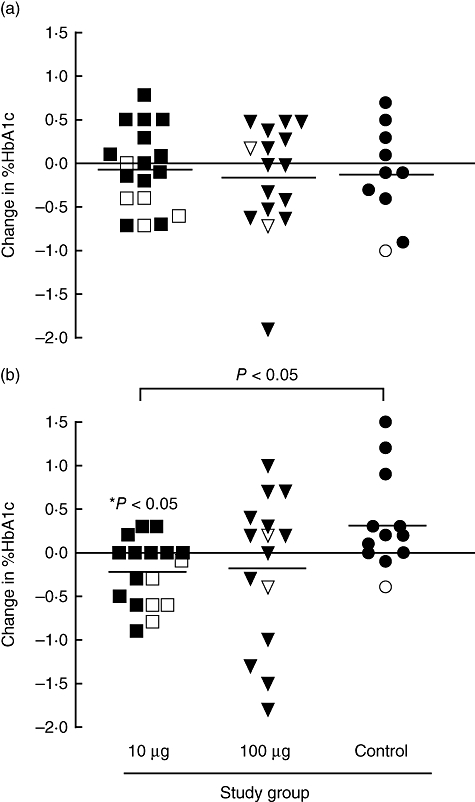
Immunotherapeutic strategies under consideration for type 1 diabetes include modification of the autoimmune response through antigen-specific routes. Administration of short peptides representing T cell epitopes targeted by patients with the disease represents one approach. This study evaluated safety and mechanistic outcomes during first-in-man intradermal administration of a human leucocyte antigen-DR4 (HLA-DR4)-restricted peptide epitope of proinsulin (C19-A3). This randomized, open-label study assessed two major theoretical risks of peptide immunotherapy, namely induction of allergic hypersensitivity and exacerbation of the proinflammatory autoimmune response, using clinical assessment and mechanistic assays in vitro. Patients with long-standing type 1 diabetes and HLA-DRB1*0401 genotype received 30 microg (n = 18) or 300 microg (n = 18) of peptide in three equal doses at 0, 1 and 2 months or no intervention (n = 12). Proinsulin peptide immunotherapy in the dosing regimen used is well tolerated and free from risk of systemic hypersensitivity and induction/reactivation of proinsulin-specific, proinflammatory T cells. Peptide-specific T cells secreting the immune suppressive cytokine interleukin (IL)-10 were observed at month 3 in four of 18 patients in the low-dose group (versus one of 12 in the control group; P = not significant). Mean IL-10 response to peptide in the low-dose group increased between 0 and 3 months (P = 0.05 after stimulation with 5 microM peptide in vitro) and then declined to baseline levels between 3 and 6 months (P = 0.01 at 10 microM peptide in vitro). These studies pave the way for future investigations in new-onset patients designed to examine whether proinsulin peptide immunotherapy has beneficial effects on markers of T cell autoimmunity and preservation of beta cell mass.


Figures

Fig. 1
Fig. 1
Graphical representation of study design, indicating timing of proinsulin peptide injections and major mechanistic studies. This template was followed for the 10 mg and 100 mg doses.
Fig. 2
Fig. 2
Prevalence and size of erythematous skin reactions among (a) 18 subjects receiving the 10 mg dose and (b) 18 subjects receiving the 100 mg dose. Bars represent reaction size in millimetre, and open, shaded and diagonal stripe bars represent first, second and third injections respectively.
Fig. 3
Fig. 3
Th2 responses to proinsulin peptide. Mean (s.e.m.) stimulation indices [(number of spots in test)/(number in control)] for cytokine ELISPOT reactivity to proinsulin peptide for IL-4, IL-5 and IL-13 at 0-, 3- and 6-month duration of the study in the different treatment groups (control subjects, n = 12; subjects in 10 mg dose group, n = 18; subjects in 100 mg dose group, n = 18; these represent the same subjects as shown in Figs 2, 4 and 5). Circle, triangle and square symbols represent 1, 5 and 10 mM concentrations of peptide used in the ELISPOT assays in vitro.
Fig. 4
Fig. 4
Proinflammatory responses to proinsulin peptide. Mean (s.e.m.) stimulation indices [(number of spots in test)/(number in control)] for cytokine ELISPOT reactivity to proinsulin peptide for IFN-γ at 0-, 3- and 6-month duration of the study in the different treatment groups (control subjects, n = 12; subjects in 10 mg dose group, n = 18; subjects in 100 mg dose group, n = 18; these represent the same subjects as shown in Figs 2, 4 and 5). Circle, triangle and square symbols represent 1, 5 and 10 mM concentrations of peptide used in the ELISPOT assays in vitro.
Fig. 5
Fig. 5
IL-10 responses to proinsulin peptide. Mean (s.e.m.) stimulation indices [(number of spots in test)/(number in control)] for cytokine ELISPOT reactivity to proinsulin peptide at 0-, 3- and 6-month duration of the study in the different treatment groups (control subjects, n = 12; subjects in 10 mg dose group, n = 18; subjects in 100 mg dose group, n = 18; these represent the same subjects as shown in Figs 2, 3 and 5). Circle, triangle and square symbols represent 1, 5 and 10 mM concentrations of peptide used in the ELISPOT assays in vitro. *Signifies that among the 10 mg dosing group the mean stimulation index rose between 0 and 3 months (P = 0·05 after in vitro stimulation with 5 mM peptide and P = 0·15 after in vitro stimulation with 10 mM); **signifies that it fell between 3 and 6 months (P = 0·08 after in vitro stimulation with 5 mM and P = 0·01 after in vitro stimulation with 10 mM peptide).
Fig. 6
Fig. 6
Representative examples of the five patients who received proinsulin peptide immunotherapy at the 10 mg dose and showed a ‘favourable’ T-cell response, either designated as induction of IL-10 secreting cells or designated as loss of IFN-γ secreting cells at 3 months [signified by stimulation index (SI) 33 at 32 peptide concentrations; dotted line indicates the cut-off]. Circle, triangle and square symbols represent 1, 5 and 10 mM concentrations of peptide used in the ELISPOT assay in vitro.
Fig. 7
Fig. 7
Change in HbA1c. Graph shows change in HbA1c level (%) between baseline and (a) 3 months (data available on 18, 14 and 10 subjects in the 10 mg, 100 mg and control groups respectively) and (b) between baseline and 6 months for each subject in each treatment group (data available on 17, 15 and 12 subjects in the 10 mg, 100 mg and control groups respectively). Subjects classified as showing favourable T-cell responses (designated as induction of IL-10 secreting cells or loss of IFN-γ secreting cells at 3 months; see Fig. 6) are shown with open symbols. Panel (b) shows that mean change in HbA1c is significantly greater in subjects in the 10-mg dosing group compared with control subjects (P < 0·05) at 6 months. *Signifies that the mean change in HbA1c (reduction from baseline) is significant in the 10 mg group (P < 0·05) but not the other groups and that in the 10 mg dosing group the IL-10 responders had a significantly higher frequency of reduction in HbA1c than the non-responder group (P < 0·05).

References

    1. Staeva-vieira T, Peakman M, von Herrath M. Translational mini-review series on type 1 diabetes: immune-based therapeutic approaches for type 1 diabetes. Clin Exp Immunol. 2007;148:17–31. - PMC - PubMed
    1. Bougneres PF, Landais P, Boisson C, et al. Limited duration of remission of insulin dependency in children with recent overt type I diabetes treated with low-dose cyclosporin. Diabetes. 1990;39:1264–72. - PubMed
    1. Herold KC, Hagopian W, Auger JA, et al. Anti-CD3 monoclonal antibody in new-onset type 1 diabetes mellitus. N Engl J Med. 2002;346:1692–8. - PubMed
    1. Keymeulen B, Vandemeulebroucke E, Ziegler AG, et al. Insulin needs after CD3-antibody therapy in new-onset type 1 diabetes. N Engl J Med. 2005;352:2598–608. - PubMed
    1. Shoda LK, Young DL, Ramanujan S, et al. A comprehensive review of interventions in the NOD mouse and implications for translation. Immun. 2005;23:115–26. - PubMed

Publication types

MeSH terms