. 2008 Nov 28:2:104.
doi: 10.1186/1752-0509-2-104.

Arena3D: visualization of biological networks in 3D

Affiliations

Arena3D: visualization of biological networks in 3D

Georgios A Pavlopoulos et al. BMC Syst Biol. .

Abstract

Background: Complexity is a key problem when visualizing biological networks; as the number of entities increases, most graphical views become incomprehensible. Our goal is to enable many thousands of entities to be visualized meaningfully and with high performance.

Results: We present a new visualization tool, Arena3D, which introduces a new concept of staggered layers in 3D space. Related data--such as proteins, chemicals, or pathways--can be grouped onto separate layers and arranged via layout algorithms, such as Fruchterman-Reingold, distance geometry, and a novel hierarchical layout. Data on a layer can be clustered via k-means, affinity propagation, Markov clustering, neighbor joining, tree clustering, or UPGMA ('unweighted pair-group method with arithmetic mean'). A simple input format defines the name and URL for each node, and defines connections or similarity scores between pairs of nodes. The use of Arena3D is illustrated with datasets related to Huntington's disease.

Conclusion: Arena3D is a user friendly visualization tool that is able to visualize biological or any other network in 3D space. It is free for academic use and runs on any platform. It can be downloaded or lunched directly from http://arena3d.org. Java3D library and Java 1.5 need to be pre-installed for the software to run.


Figures
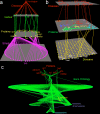
Figure 1
Figure 1
Screenshots of Arena3D showing data related to Huntington's disease. 1a shows the result of a query starting from Huntington's disease. HD is related to nine associated genes which are linked to 10 proteins, the Huntingtin gene 'htt' shows two forms, mutant and wild-type. These proteins link to 75 protein structures. 1b shows nine polyQ-related diseases (top layer). On the middle layer, 66 proteins known to be associated to these diseases were clustered, and on the bottom layer 151 domains associated with these 66 proteins are shown. On the middle layer we have highlighted 6 proteins that are involved in both Huntington and another polyQ disease, and on the bottom layer we have highlighted the 8 domains present in these six proteins. WW and atrophin domains are connected with proteins related to different diseases. 1c shows the proteins related to Huntingtin (top, red) and their connection to the GO ontology hierarchy.
Figure 2
Figure 2
Illustration of how Arena3D can show connections between different data types and cluster data. The layer in the top centre position shows the 9 proteins associated with Huntingtin. We selected rasa1 protein and highlighted its connections to GO terms using our novel hierarchical layout (left image). In addition, we show connections from the nine Huntingtin-related proteins to a group of associated chemicals (bottom, center). These chemicals are shown clustered by affinity propagation, and by tree clustering (right image). In both cases the clustering is based on Tanimoto scores. The figure also illustrates how layers can be moved and rotated to allow better views on the data.

References

    1. Shannon P, Markiel A, Ozier O, Baliga NS, Wang JT, Ramage D, Amin N, Schwikowski B, Ideker T. Cytoscape: a software environment for integrated models of biomolecular interaction networks. Genome Res. 2003;13:2498–2504. doi: 10.1101/gr.1239303. - DOI - PMC - PubMed
    1. Breitkreutz BJ, Stark C, Tyers M. Osprey: a network visualization system. Genome Biol. 2003;4:R22. doi: 10.1186/gb-2003-4-3-r22. - DOI - PMC - PubMed
    1. Hooper SD, Bork P. Medusa: a simple tool for interaction graph analysis. Bioinformatics. 2005;21:4432–4433. doi: 10.1093/bioinformatics/bti696. - DOI - PubMed
    1. Iragne F, Nikolski M, Mathieu B, Auber D, Sherman D. ProViz: protein interaction visualization and exploration. Bioinformatics. 2005;21:272–274. doi: 10.1093/bioinformatics/bth494. - DOI - PubMed
    1. Batada NN. CNplot: visualizing pre-clustered networks. Bioinformatics. 2004;20:1455–1456. doi: 10.1093/bioinformatics/bth080. - DOI - PubMed

LinkOut - more resources