

Absolute quantification of the budding yeast transcriptome by means of competitive PCR between genomic and complementary DNAs
- PMID: 19040753
- PMCID: PMC2612024
- DOI: 10.1186/1471-2164-9-574
Absolute quantification of the budding yeast transcriptome by means of competitive PCR between genomic and complementary DNAs
Abstract
Background: An ideal format to describe transcriptome would be its composition measured on the scale of absolute numbers of individual mRNAs per cell. It would help not only to precisely grasp the structure of the transcriptome but also to accelerate data exchange and integration.
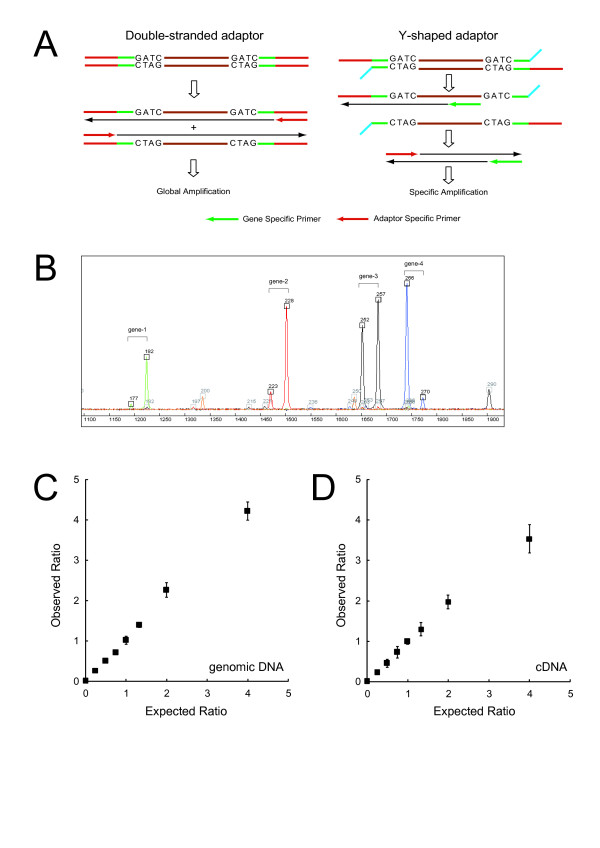
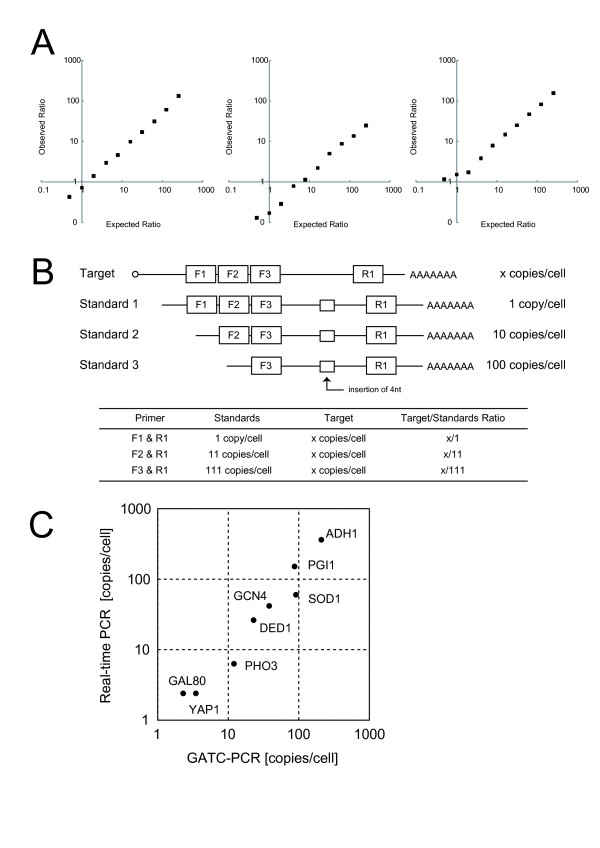
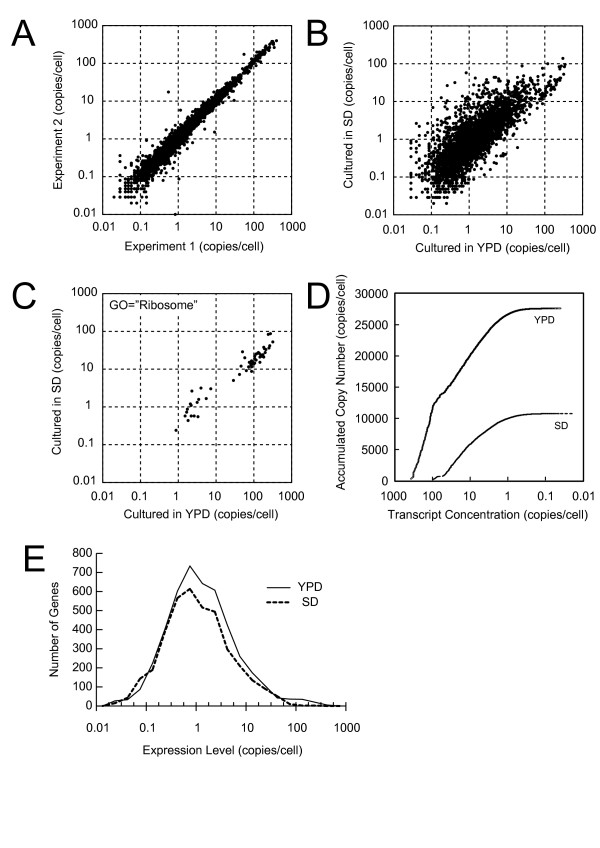
Results: We conceived an idea of competitive PCR between genomic DNA and cDNA. Since the former contains every gene exactly at the same copy number, it can serve as an ideal normalization standard for the latter to obtain stoichiometric composition data of the transcriptome. This data can then be easily converted to absolute quantification data provided with an appropriate calibration. To implement this idea, we improved adaptor-tagged competitive PCR, originally developed for relative quantification of the 3'-end restriction fragment of each cDNA, such that it can be applied to any restriction fragment. We demonstrated that this "generalized" adaptor-tagged competitive PCR (GATC-PCR) can be performed between genomic DNA and cDNA to accurately measure absolute expression level of each mRNA in the budding yeast Saccharomyces cerevisiae. Furthermore, we constructed a large-scale GATC-PCR system to measure absolute expression levels of 5,038 genes to show that the yeast contains more than 30,000 copies of mRNA molecules per cell.
Conclusion: We developed a GATC-PCR method to accurately measure absolute expression levels of mRNAs by means of competitive amplification of genomic and cDNA copies of each gene. A large-scale application of GATC-PCR to the budding yeast transcriptome revealed that it is twice or more as large as previously estimated. This method is flexibly applicable to both targeted and genome-wide analyses of absolute expression levels of mRNAs.
Figures
References
-
- Brazma A, Robinson A, Cameron G, Ashburner M. One-stop shop for microarray data. Nature. 2000;403:699–700. - PubMed
-
- Okubo K, Hori N, Matoba R, Niiyama T, Fukushima A, Kojima Y, Matsubara K. Large scale cDNA sequencing for analysis of quantitative and qualitative aspects of gene expression. Nat Genet. 1992;2:173–179. - PubMed
-
- Velculescu VE, Zhang L, Vogelstein B, Kinzler KW. Serial analysis of gene expression. Science. 1995;270:484–487. - PubMed
-
- Brenner S, Johnson M, Bridgham J, Golda G, Lloyd DH, Johnson D, Luo S, McCurdy S, Foy M, Ewan M, Roth R, George D, Eletr S, Albrecht G, Vermaas E, Williams SR, Moon K, Burcham T, Pallas M, DuBridge RB, Kirchner J, Fearon K, Mao J, Corcoran K. Gene expression analysis by massively parallel signature sequencing (MPSS) on microbead arrays. Nat Biotechnol. 2000;18:630–634. - PubMed
-
- Shiraki T, Kondo S, Katayama S, Waki K, Kasukawa T, Kawaji H, Kodzius R, Watahiki A, Nakamura M, Arakawa T, Fukuda S, Sasaki D, Podhajska A, Harbers M, Kawai J, Carninci P, Hayashizaki Y. Cap analysis gene expression for high-throughput analysis of transcriptional starting point and identification of promoter usage. Proc Natl Acad Sci USA. 2003;100:15776–15781. - PMC - PubMed
Publication types
MeSH terms
Substances
LinkOut - more resources
Full Text Sources
Other Literature Sources
Molecular Biology Databases
