Multicenter Study
. 2009 Mar;45(1 Suppl):S3-15.
doi: 10.1016/j.neuroimage.2008.10.043. Epub 2008 Nov 8.

Automated mapping of hippocampal atrophy in 1-year repeat MRI data from 490 subjects with Alzheimer's disease, mild cognitive impairment, and elderly controls

Affiliations
Multicenter Study

Automated mapping of hippocampal atrophy in 1-year repeat MRI data from 490 subjects with Alzheimer's disease, mild cognitive impairment, and elderly controls

Jonathan H Morra et al. Neuroimage. 2009 Mar.

Abstract

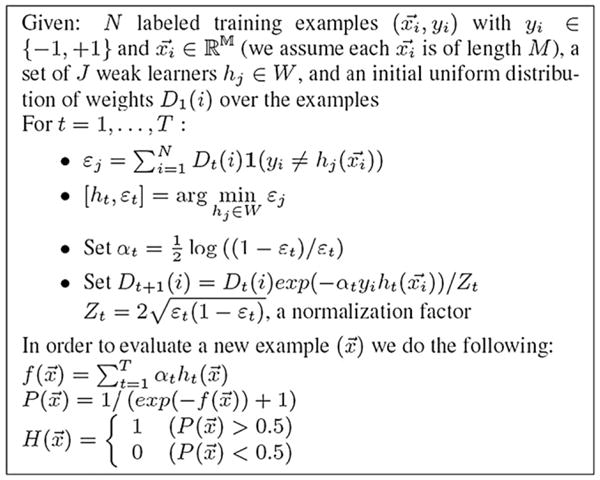
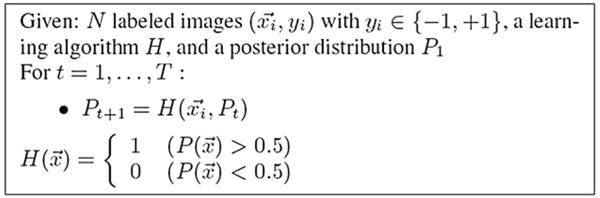
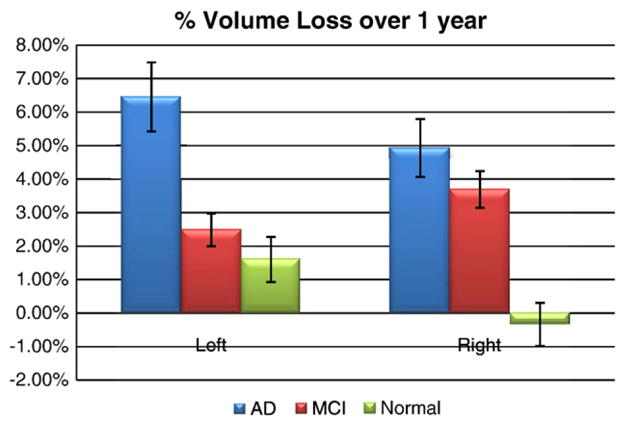
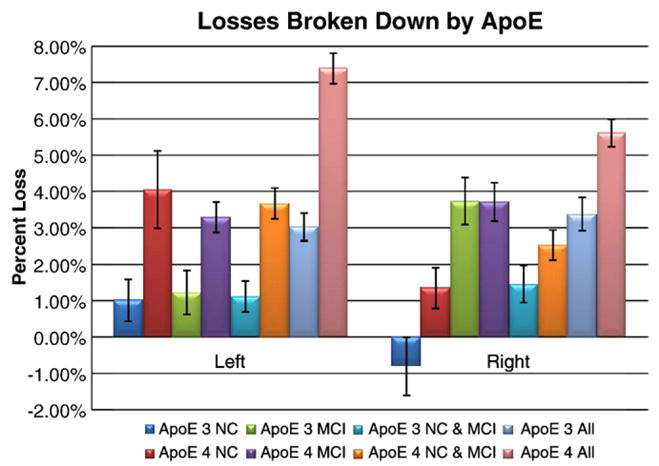
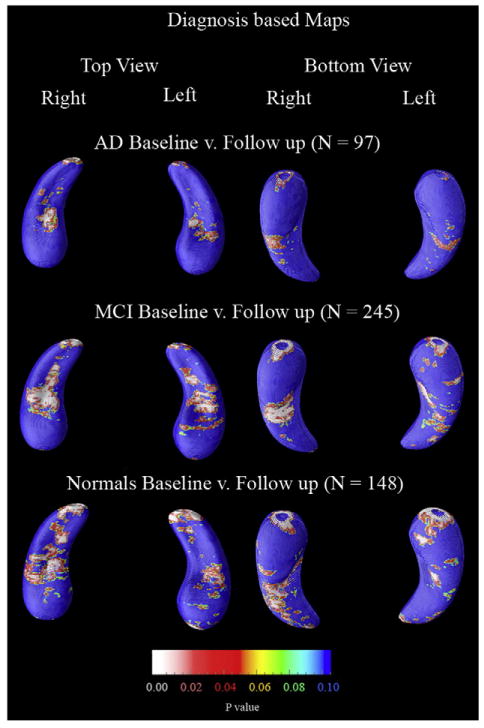
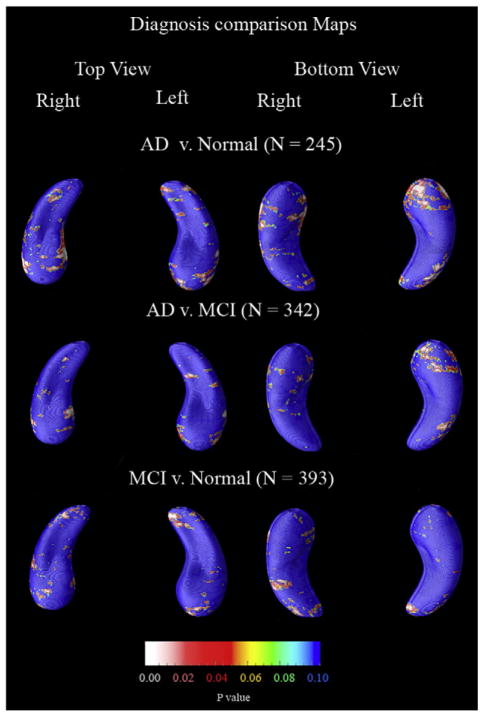
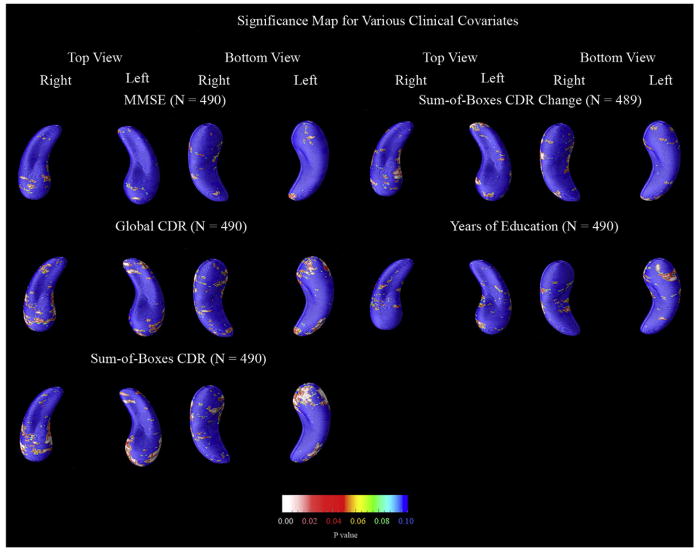
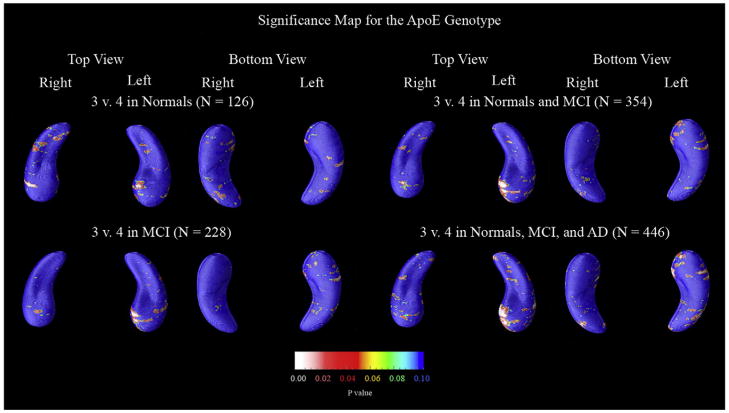
As one of the earliest structures to degenerate in Alzheimer's disease (AD), the hippocampus is the target of many studies of factors that influence rates of brain degeneration in the elderly. In one of the largest brain mapping studies to date, we mapped the 3D profile of hippocampal degeneration over time in 490 subjects scanned twice with brain MRI over a 1-year interval (980 scans). We examined baseline and 1-year follow-up scans of 97 AD subjects (49 males/48 females), 148 healthy control subjects (75 males/73 females), and 245 subjects with mild cognitive impairment (MCI; 160 males/85 females). We used our previously validated automated segmentation method, based on AdaBoost, to create 3D hippocampal surface models in all 980 scans. Hippocampal volume loss rates increased with worsening diagnosis (normal=0.66%/year; MCI=3.12%/year; AD=5.59%/year), and correlated with both baseline and interval changes in Mini-Mental State Examination (MMSE) scores and global and sum-of-boxes Clinical Dementia Rating scale (CDR) scores. Surface-based statistical maps visualized a selective profile of ongoing atrophy in all three diagnostic groups. Healthy controls carrying the ApoE4 gene atrophied faster than non-carriers, while more educated controls atrophied more slowly; converters from MCI to AD showed faster atrophy than non-converters. Hippocampal loss rates can be rapidly mapped, and they track cognitive decline closely enough to be used as surrogate markers of Alzheimer's disease in drug trials. They also reveal genetically greater atrophy in cognitively intact subjects.


Conflict of interest statement

Conflict of interest

The authors declare that there are no conflicts of interest.

Figures

Fig. 1
Fig. 1
An overview of the AdaBoost algorithm. The x vectors are the feature vectors at each voxel (there are N voxels), and the y values are the ground truth classifications (+1 for hippocampus, −1 for non-hippocampus). Weak learners are defined to be classifiers that give binary outputs regarding a voxel’s class, based on one single feature and a threshold value for that feature. Weak learners are classification functions based on any feature that can help to classify a structure correctly with an accuracy slightly better than chance. The algorithm gives an update rule for the weightings given to each of the labeled examples, in training this set of weak learners, and the epsilon terms are the sum of the weights. The Dt vector represents the importance of each example, and examples misclassified at one iteration of the algorithm receive more weight on subsequent iterations, and those that are correctly classified receive less weight in the subsequent iterations. 1 is an indicator function, returning 1 if the expression is true and 0 otherwise. The function f is a function combining the outputs of all the weak learners using weights (the alpha terms). P is a probability function that gives the Bayesian maximum a posteriori (MAP) estimate of the labeling (Morra et al., 2008c). The H function thresholds the posterior distribution P at the threshold of 1/2, returning a decision as to whether each voxel x belongs to the hippocampus (1 for yes and 0 for no).
Fig. 2
Fig. 2
An overview of the auto context model. Here, H() is a cascade of AdaBoosts. Essentially, the labeling at each iteration of AdaBoost is fed back into the learning process as a new feature along with neighborhood-based information calculated on this map, which allows neighboring voxels to influence each other probabilistically. Convergence criteria and more details are presented in our previous work (Morra et al., 2008c).
Fig. 3
Fig. 3
The percentage of hippocampal volume loss over a 1-year interval. As expected, the AD group had the most rapid tissue loss, followed by MCI and then normal subjects.
Fig. 4
Fig. 4
Hippocampal loss rates broken down by ApoE genotype. Values here correspond to Table 5; for all cases except MCI on the right side, ApoE4 carriers lost hippocampal volume more rapidly than non-carriers. One surprising aspect here is the left/right difference in the effect of ApoE4 in MCI: as seen in Fig. 3, the MCIs have right faster than left atrophy, overall. Within this MCI group, the E3 carriers (green bars) have right faster than left atrophy, but the E4 carriers (purple bars) have atrophy on the left that is almost as fast as on the right. Most investigators would be surprised to see a lateralized effect of ApoE, but it remains possible that the left hippocampus, which atrophies significantly faster than the right hippocampus in controls, maintains its rate of atrophy in MCI E3 carriers, but accelerates its rate of atrophy in MCI E4 carriers. If this is true, then the accelerative effect of the ApoE4 risk genotype may not be simply superimposed on the rate of atrophy in all groups uniformly in both hemispheres, but may accelerate the pregression of left hippocampal atrophy more than the right in MCI. As these asymmetries in the ApoE4 effect were not expected, they require independent replication.
Fig. 5
Fig. 5
Statistical maps (p-maps) showing the significance of progressive atrophy over 1 year broken down by diagnosis. All maps showed significant changes overall by permutation testing (Table 9).
Fig. 6
Fig. 6
P-maps showing between-group differences in atrophic rates. Overall only the two most diagnostically different groups proved to be significantly different (AD vs. Normals) as shown in Table 9.
Fig. 7
Fig. 7
Maps of clinical and demographic factors that could be associated with hippocampal atrophy rates. These maps show the significance of correlations between a change in radial distance at each hippocampal surface point and various clinical covariates. Each map presented here was statistically significant, on at least one side, after multiple comparisons correction by permutation testing (Table 9). Maps are shown for all clinical covariates that proved significant, among those examined in this study. The maps for the sum-of-boxes CDR change were based on only 489 subjects (one less than the other maps) because one subject’s sum-of-boxes CDR score was not obtained at follow-up.
Fig. 8
Fig. 8
P-maps of the effect of ApoE4 status on hippocampal loss rates. For these maps, subjects that had a genotype of 3/3 were categorized as ApoE3, and those that had 3/4, 4/3, or 4/4 were considered as ApoE4. Only when all subjects are pooled is the gene effect significant – on the left side. Even so, the same area of the hippocampus has low p-values in all groups (even when normal and MCI patients are split), suggesting that this area may be a region of interest for gene effects in future samples.

References

    1. Alexander GE, Chen K, Merkley TL, Reiman EM, Caselli RJ, Aschenbrenner M, Santerre-Lemmon L, Lewis DJ, Pietrini P, Teipel SJ, Hampel H, Rapoport SI, Moeller JR. Regional network of magnetic resonance imaging gray matter volume in healthy aging. NeuroReport. 2006;17:951–956. - PubMed
    1. Apostolova LG, Thompson PM. Brain mapping as a tool to study neurodegeneration. Neurotherapeutics. 2007;4:387–400. - PMC - PubMed
    1. Apostolova LG, Dinov ID, Dutton RA, Hayashi KM, Toga AW, Cummings JL, Thompson PM. 3D comparison of hippocampal atrophy in amnestic mild cognitive impairment and Alzheimer’s disease. Brain. 2006a;129:2867–2873. - PubMed
    1. Apostolova LG, Dutton RA, Dinov ID, Hayashi KM, Toga AW, Cummings JL, Thompson PM. Conversion of mild cognitive impairment to Alzheimer disease predicted by hippocampal atrophy maps. Arch Neurol. 2006b;63:693–699. - PubMed
    1. Apostolova LG, Akopyan GG, Partiali N, Steiner CA, Dutton RA, Hayashi KM, Dinov ID, Toga AW, Cummings JL, Thompson PM. Structural correlates of apathy in Alzheimer’s disease. Dement Geriatr Cogn Disord. 2007;24:91–97. - PubMed

Publication types

Substances