

Macrophage EP4 deficiency increases apoptosis and suppresses early atherosclerosis
- PMID: 19041765
- PMCID: PMC2614698
- DOI: 10.1016/j.cmet.2008.09.005
Macrophage EP4 deficiency increases apoptosis and suppresses early atherosclerosis
Abstract
Prostaglandin (PG) E(2), a major product of activated macrophages, has been implicated in atherosclerosis and plaque rupture. The PGE(2) receptors, EP2 and EP4, are expressed in atherosclerotic lesions and are known to inhibit apoptosis in cancer cells. To examine the roles of macrophage EP4 and EP2 in apoptosis and early atherosclerosis, fetal liver cell transplantation was used to generate LDLR(-/-) mice chimeric for EP2(-/-) or EP4(-/-) hematopoietic cells. After 8 weeks on a Western diet, EP4(-/-) --> LDLR(-/-) mice, but not EP2(-/-) --> LDLR(-/-) mice, had significantly reduced aortic atherosclerosis with increased apoptotic cells in the lesions. EP4(-/-) peritoneal macrophages had increased sensitivity to proapoptotic stimuli, including palmitic acid and free cholesterol loading, which was accompanied by suppression of activity of p-Akt, p-Bad, and NF-kappaB-regulated genes. Thus, EP4 deficiency inhibits the PI3K/Akt and NF-kappaB pathways compromising macrophage survival and suppressing early atherosclerosis, identifying macrophage EP4-signaling pathways as molecular targets for modulating the development of atherosclerosis.
Figures
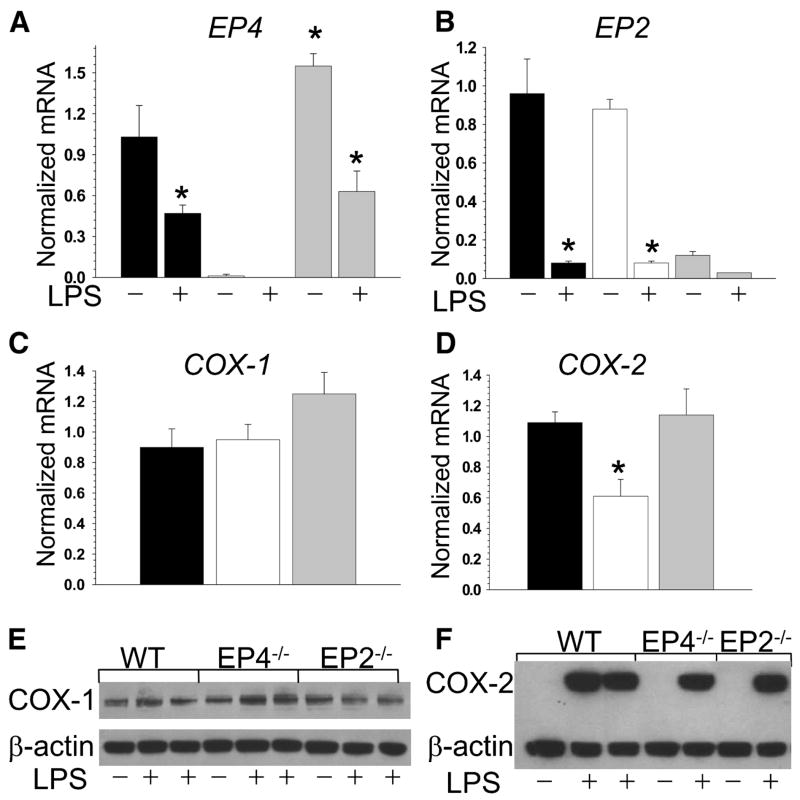
 ) FLC and fed with the Western diet for 8 weeks. Macrophages were treated with media alone (control) or with LPS (50ng/ml) for 5 hours. The gene expression levels were measured by real-time PCR. Graphs represent data (Mean ± SEM) with the same number (n=3) of mice per group (*p<0.05 between control and treated with LPS cells of the same group, and between WT and EP4−/− cells by One Way ANOVA analysis). (E,F) COX-1 (E) and COX-2 (F) protein levels in peritoneal macrophages. Macrophages were treated with media alone or with LPS for 5 hours. Cell extract (20μg/line) was resolved on 10% Bis-Tris gel and analyzed by Western blot.
 ) FLCs. The data are represented as the average of total cholesterol of mice (n=3 per group) reconstituted different FLC and fed with the Western diet for 8 weeks. Fractions 14–17 contain VLDL; fractions 18–24 are IDL/LDL; and fractions 25–30 contain HDL. (B–D) Atherosclerotic lesions in aorta en face (B) and extent of atherosclerotic lesion area in the distal (C) and proximal (D) aortas of LDLR−/− mice reconstituted WT(•), EP4−/−(○), or EP2−/−(
) FLCs. Graphs represent data (Mean ± SEM) with different number (n=12, 13 and 13, respectively) mice of each genotype (p<0.05 between control and reconstituted with EP4−/− FLC groups by One Way ANOVA analysis, the Tukey test).
) FLCs. The data are represented as the average of total cholesterol of mice (n=3 per group) reconstituted different FLC and fed with the Western diet for 8 weeks. Fractions 14–17 contain VLDL; fractions 18–24 are IDL/LDL; and fractions 25–30 contain HDL. (B–D) Atherosclerotic lesions in aorta en face (B) and extent of atherosclerotic lesion area in the distal (C) and proximal (D) aortas of LDLR−/− mice reconstituted WT(•), EP4−/−(○), or EP2−/−(
) FLCs. Graphs represent data (Mean ± SEM) with different number (n=12, 13 and 13, respectively) mice of each genotype (p<0.05 between control and reconstituted with EP4−/− FLC groups by One Way ANOVA analysis, the Tukey test).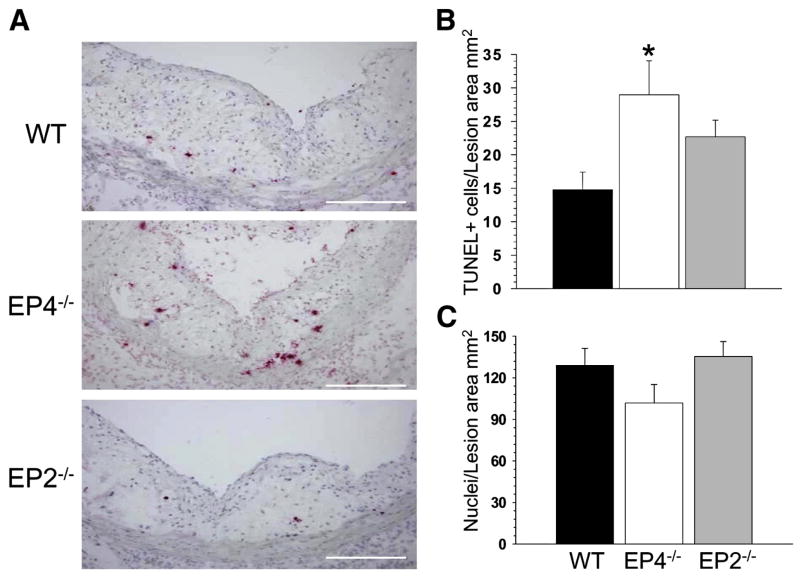 ) FLC and fed with the Western diet for 8 weeks. Graphs represent data (Mean ± SEM) with different number (n=12, 13 and 13, respectively) mice per group (*p<0.05 between mice reconstituted with WT and EP4−/− cells by One Way ANOVA analysis).
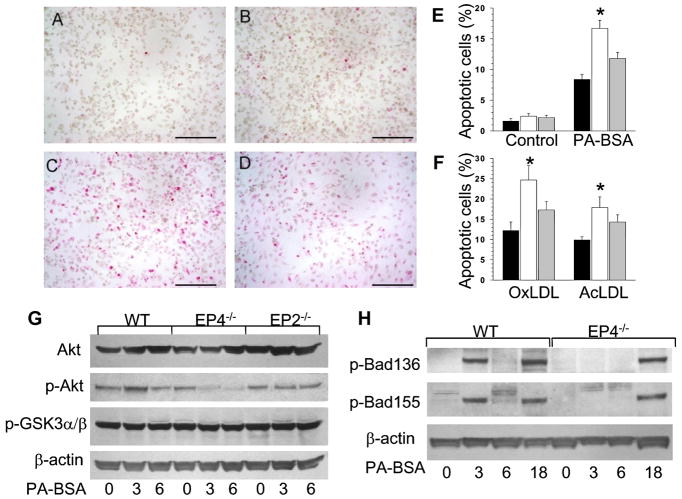 ) macrophages untreated or treated with PA-BSA (E), oxLDL (100μg/ml) or AcLDL (100μg/ml) plus an ACAT inhibitor, Sandoz 58035 (10μg/ml) (F) for 24 hours. Graphs represent data (Mean ± SEM) with the same number (n=3) of mice per group (*p<0.05 between WT and EP4−/− cells by One Way ANOVA analysis) (G,H) Expression of Akt, p-Akt(Ser473), and p-GSK3α/β(H), p-Bad(Ser136 and 155) and β-actin (J) in WT, EP4−/− or EP2−/− peritoneal macrophages untreated and treated with PA-BSA (0.5mM) for 3,6 or 18 hours. Cell extract (100μg/line) was resolved and analyzed by Western blot using antibodies against the proteins as indicated.
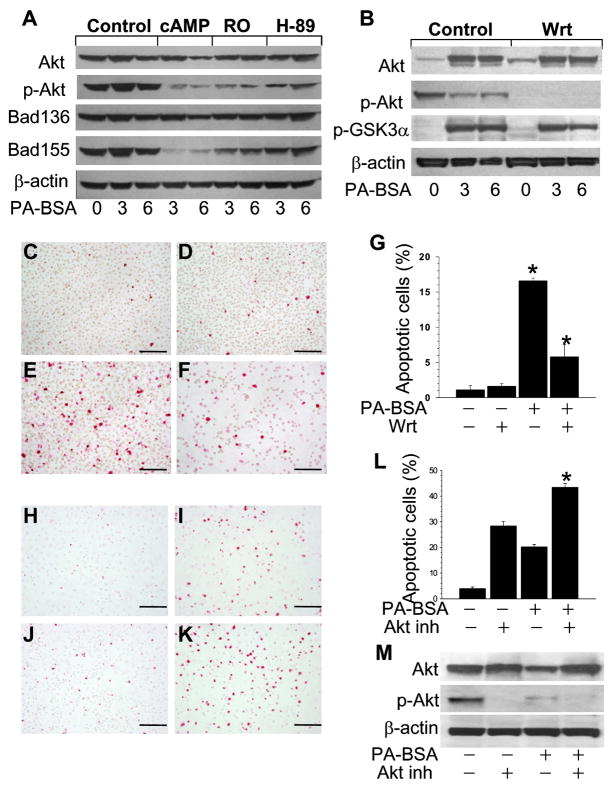
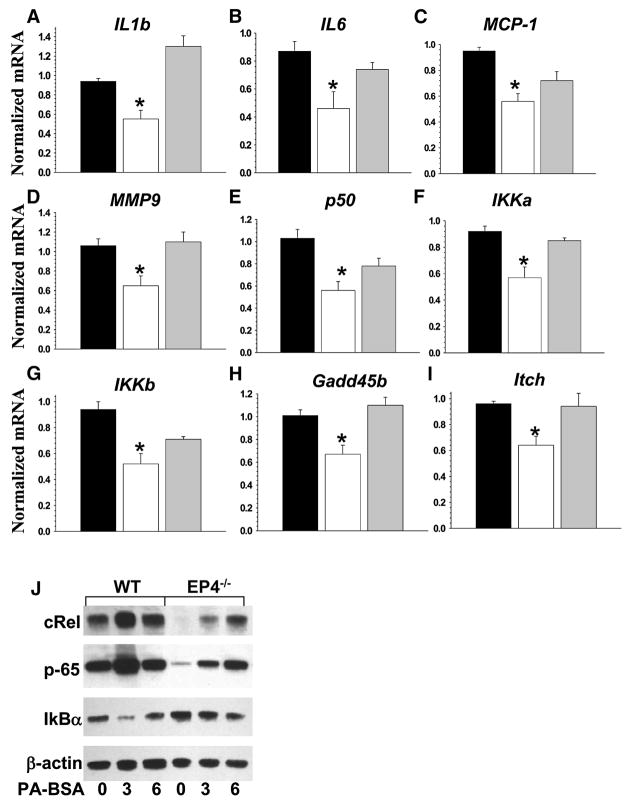 ) macrophages. The cells were treated with LPS (50nM) for 5 hours and gene expression levels were measured by real-time PCR. Graphs represent data (Mean ± SEM) of two experiments with the same number (n=3) mice per group (*p<0.05 between WT and EP4−/− cells by One Way ANOVA analysis). (J). Protein expression levels in WT and EP4−/− macrophages treated with PA-BSA (500 μM) for 3 and 6 hours. Cell extract (100μg/line) was resolved and analyzed by Western blot. The graph represents the data of two different experiments.
References
-
- Arai S, Shelton JM, Chen M, Bradley MN, Castrillo A, Bookout AL, Mak PA, Edwards PA, Mangelsdorf DJ, Tontonoz P, Miyazaki T. A role for the apoptosis inhibitory factor AIM/Spalpha/Api6 in atherosclerosis development. Cell Metabolism. 2005;1:201–213. - PubMed
-
- Babaev VR, Ishiguro H, Ding L, Yancey PG, Dove DE, Kovacs WJ, Semenkovich CF, Fazio S, Linton MF. Macrophage expression of peroxisome proliferator-activated receptor-alpha reduces atherosclerosis in low-density lipoprotein receptor-deficient mice. Circulation. 2007;116:1404–1412. - PubMed
-
- Babaev VR, Yancey PG, Ryzhov SV, Kon V, Breyer MD, Magnuson MA, Fazio S, Linton MF. Conditional knockout of macrophage PPAR{gamma} increases atherosclerosis in C57BL/6 and low-density lipoprotein receptor-deficient mice. Arterioscler Thromb Vasc Biol. 2005;25:1647–1653. - PubMed
-
- Backlund MG, Mann JR, Dubois RN. Mechanisms for the prevention of gastrointestinal cancer: the role of prostaglandin E2. Oncology. 2005;1:28–32. - PubMed
Publication types
MeSH terms
Substances
Grants and funding
- R01 HL053989/HL/NHLBI NIH HHS/United States
- HL53989/HL/NHLBI NIH HHS/United States
- HL65405/HL/NHLBI NIH HHS/United States
- P01 GM015431/GM/NIGMS NIH HHS/United States
- HL65709/HL/NHLBI NIH HHS/United States
- P50 GM015431/GM/NIGMS NIH HHS/United States
- R01 HL057986/HL/NHLBI NIH HHS/United States
- HL57986/HL/NHLBI NIH HHS/United States
- DK37097/DK/NIDDK NIH HHS/United States
- U24 DK059637/DK/NIDDK NIH HHS/United States
- GM15431/GM/NIGMS NIH HHS/United States
- R01 HL086988/HL/NHLBI NIH HHS/United States
- R01 HL065405/HL/NHLBI NIH HHS/United States
- DK59637/DK/NIDDK NIH HHS/United States
- R01 HL065709/HL/NHLBI NIH HHS/United States
- R01 DK037097/DK/NIDDK NIH HHS/United States
LinkOut - more resources
Full Text Sources
Other Literature Sources
Medical
Molecular Biology Databases
Research Materials
