. 2008 Dec;8(6):512-21.
doi: 10.1016/j.cmet.2008.10.008.

Switch-like control of SREBP-2 transport triggered by small changes in ER cholesterol: a delicate balance

Affiliations

Switch-like control of SREBP-2 transport triggered by small changes in ER cholesterol: a delicate balance

Arun Radhakrishnan et al. Cell Metab. 2008 Dec.

Abstract

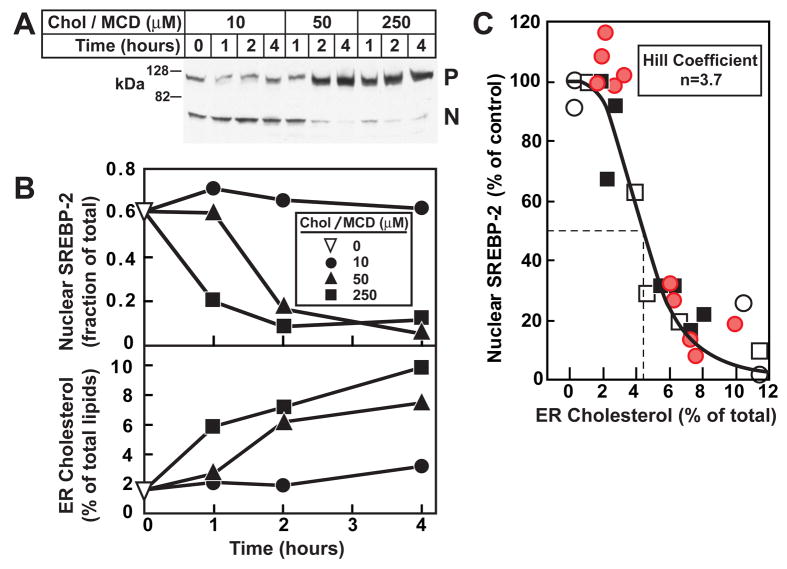
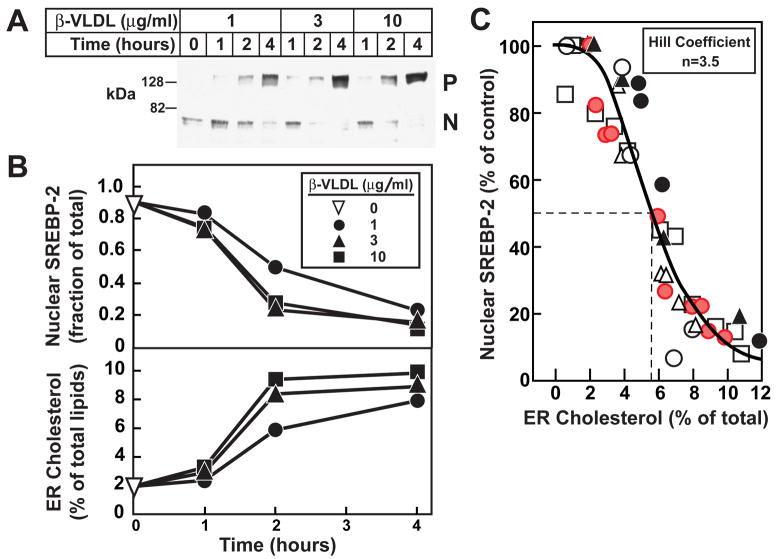
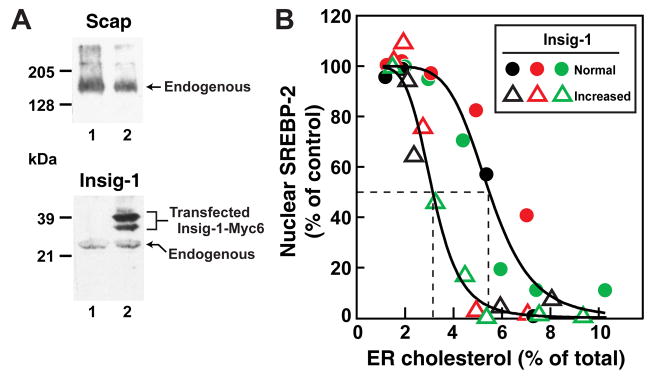
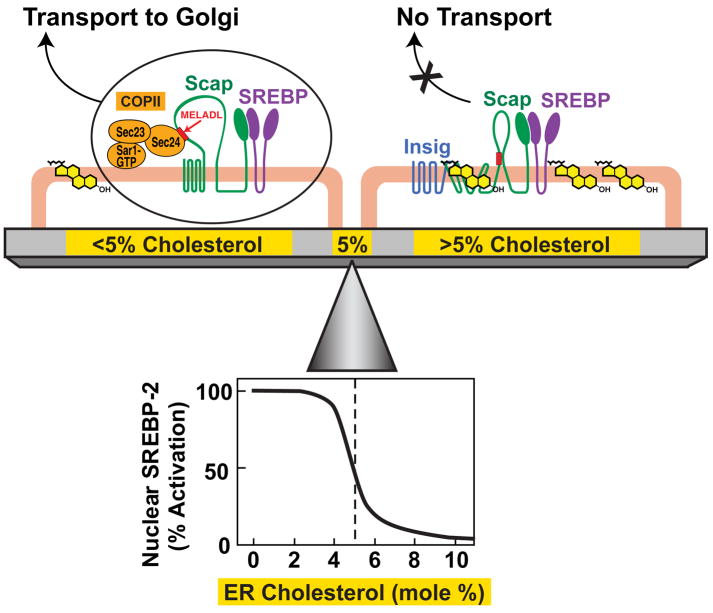
Animal cells control their membrane lipid composition within narrow limits, but the sensing mechanisms underlying this control are largely unknown. Recent studies disclosed a protein network that controls the level of one lipid-cholesterol. This network resides in the endoplasmic reticulum (ER). A key component is Scap, a tetrameric ER membrane protein that binds cholesterol. Cholesterol binding prevents Scap from transporting SREBPs to the Golgi for activation. Using a new method to purify ER membranes from cultured cells, we show that Scap responds cooperatively to ER cholesterol levels. When ER cholesterol exceeds 5% of total ER lipids (molar basis), SREBP-2 transport is abruptly blocked. Transport resumes when ER cholesterol falls below the 5% threshold. The 5% threshold is lowered to 3% when cells overexpress Insig-1, a Scap-binding protein. Cooperative interactions between cholesterol, Scap, and Insig create a sensitive switch that controls the cholesterol composition of cell membranes with remarkable precision.


Figures

Figure 1
Figure 1. Step 1 in Purification of ER Membranes from CHO-K1 Cells: Elimination of Nuclear Mitochondrial, Plasma, Golgi, and Early Endosomal Membranes
(Left Panel) Diagram of ER membrane fractionation scheme. A-G denote major fractions recovered and analyzed by immunoblot analysis. (Right Panel) CHO-K1 cells (~2×10⁸) were treated according to the fractionation scheme as described in Experimental Procedures and shown at the left. Cells were disrupted using a ball-bearing homogenizer and centrifuged at 3000g. The supernatant was then loaded at the top of a discontinuous sucrose gradient and centrifuged at 100,000g for 1 hr, yielding two distinct membrane layers. After this step, aliquots representing equal volumes of each fraction (A–E) were subjected to immunoblot analysis for the indicated organelle markers.
Figure 2
Figure 2. Step 2 in Purification of ER Membranes from CHO-K1 Cells: Elimination of Lysosomal and Peroxisomal Membranes
CHO-K1 cells (~2×10⁸) were fractionated as described in Experimental Procedures. The heavy membrane fraction obtained after the discontinuous sucrose gradient step (Fraction E, see Figure 1) was loaded below a continuous 19%–25% iodixanol gradient, centrifuged for 2 hr at 110,000g, after which fractions were collected from the bottom. Equal volumes of each fraction were subjected to immunoblot analysis for the indicated organelle markers (A) or assayed for the indicated enzyme activity (B, C). Tubes 2–7 correspond to (Fraction G) and Tube 13 corresponds to Fraction F (see Figure 1). Membranes from Fractions F and G (obtained after fractionation of ~4×10⁸ CHO-K1 cells) were processed and visualized by election microscopy as described in Experimental Procedures. Representative images of Fraction G (purified ER) and Fraction F (mixture of lysosomes, peroxisomes, and ER) are shown in panels D and E, respectively. Scale bar = 500 nm.
Figure 3
Figure 3. Analysis of SREBP-2 Processing and Its Relation to Sterol Content of Purified ER Membranes in CHO-K1 Cells after Various Treatments
On day 0, CHO-K1 cells were set up as described in Experimental Procedures in medium B (5% FCS). On day 3, cells were washed with phosphate-buffered saline and each dish received one of the following types of medium: (A) Medium C (lipoprotein-deficient serum) containing 1% HPCD for the indicated times; (B) Medium C containing 1% HPCD for 1 hr, then switched to Medium C containing 50 μM cholesterol complexed to MCD for the indicated time; or (C) Medium C containing 1% HPCD for 1 hr, then switched to Medium C containing 10 μM 25-HC complexed to MCD for the indicated time. At the indicated time, cells were harvested and disrupted by a ball-bearing homogenizer. A portion of the homogenate (5% of total) was saved for lipid analysis and immunoblot analysis of SREBP-2 (30 μg/lane) (P, precursor form; N, cleaved nuclear form). The remainder (95%) of the homogenized cells was used to purify ER membranes. Lipids were extracted from both the homogenate and the purified ER, and the amount of cholesterol, 25-HC, and phospholipids was quantified as described in Experimental Procedures. Approximately 5×10⁷ cells (from 5 10-cm dishes) were used for each data point. The amount of sterol in each fraction was expressed as the percent of total amount of phospholipid, cholesterol, and 25-HC.
Figure 4
Figure 4. Relation of SREBP-2 Processing to Cholesterol Content of Purified ER Membranes after Treatment of CHO-K1 Cells with Increasing Amounts of Cholesterol Complexed to MCD for Various Times
(A) On day 0, CHO-K1 cells were set up in Medium B (5% FCS). On day 3, cells were switched to Medium C (lipoprotein-deficient serum) containing 1% HPCD for 1 hr, then switched to Medium C containing the indicated concentration of cholesterol complexed to MCD. At the indicated time, cells were harvested and disrupted by a ball-bearing homogenizer. A portion of the homogenate (5% of total) was saved for immunoblot analysis of SREBP-2 (30 μg/lane). P, precursor form of SREBP-2; N, cleaved nuclear form of SREBP-2. (B, top panel) Densitometric quantification of SREBP-2 in (A) expressed as the amount of the nuclear form relative to the total (nuclear plus precursor). ▽, zero-time value. (B, bottom panel) The remainder (95%) of the homogenate from (A) were used to purify ER membranes, after which the lipids were extracted and the amount of cholesterol and phospholipids was quantified as described in Experimental Procedures. (C) This graph represents the data from panels A and B (red circles) and three other similar experiments (●, ○, □). For each of the four experimemts, the amount of nuclear SREBP-2 at zero time was normalized to 100%. Approximately 5×10⁷ cells (from 5 10-cm dishes) were used for each data point. The solid line represents a best-fit of the experimental data to the Hill equation as described in Experimental Procedures. The best-fit values with 95% confidence intervals for cholesterol concentration (mol%) corresponding to 50% inhibition of SREBP-2 processing and the Hill coefficient were 4.5% ± 0.45% amd 3.7 ± 0.23, respectively.
Figure 5
Figure 5. Relation of SREBP-2 Processing to Cholesterol Content of Purified ER Membranes in CHO-K1 Cells after Incubation with Increasing Amounts of β-VLDL for Various Times
(A) On day 0, CHO-K1 cells were set up in medium B (5% FCS). On day 3, cells were switched to medium C (lipoprotein-deficient serum) containing 1% HPCD for 1 hr, then switched to medium C containing the indicated concentration of β-VLDL. At the indicated time, cells were harvested and disrupted by a ball-bearing homogenizer. A portion of the homogenate (5% of total) was saved for immunoblot analysis of SREBP-2 (30 μg/lane). P, precursor form of SREBP-2; N, cleaved nuclear from of SREBP-2. (B, top panel) Densitometric quantification of SREBP-2 in (A) expressed as the amount of the nuclear form relative to the total (nuclear plus precursor). ▽, zero-time value. (B, bottom panel) The remainder (95%) of the homogenized cells from (A) were used to purify ER membranes, after which the lipids were extracted and the amount of cholesterol and phospholipids was quantified (C) This graph represents the data from panels A and B (red circles) and five other similar experiments (○, ●, □, △, ▲). For each of the six experiments, the amount of nuclear SREBP-2 at zero time was normalized to 100%. Approximately 5×10⁷ cells (from 5 10-cm dishes) were used for each data point. The solid line represents a best-fit of the experimental data to the Hill equation as described in Experimental Procedures. The best-fit values with 95% confidence intervals for cholesterol concentration (mol%) corresponding to 50% inhibition of SREBP-2 processing and the Hill coefficient were 5.7% ± 0.28% and 3.5 ± 0.13, respectively.
Figure 6
Figure 6. Relation of SREBP-2 Processing to Cholesterol Content of Purified ER Membranes in CHO-7 Cells Expressing Normal or Increased Ratio of Insig to Scap
On day 0, CHO-7 or CHO/pInsig1-Myc cells were set up in Medium B (5% FCS). On day 3, cells were switched to Medium C (lipoprotein-deficient serum) containing 1% HPCD for 1 hr, then switched to Medium C containing various concentrations of cholesterol complexed to MCD or β-VLDL. After various times of incubation, cells were harvested and disrupted by a ball-bearing homogenizer. A portion of the homogenate (5% of total) was saved for immunoblot analysis of SREBP-2 (30 μg/lane). The extent of SREBP-2 processing to its cleaved nuclear form was quantified as described in the legend to Figure 4. The remainder (95%) of the homogenate was used to purify ER membranes, after which lipids were extracted, and the amount of cholesterol and phospholipids was quantified as described in Experimental Procedures. (A) Immunoblot analysis of Scap and Insig-1 levels in the whole cell lysate (400 μg/lane) from CHO-7 cells (lane 1) and CHO/pInsig1-Myc cells (lane 2). (B) The graph represents the combined data from two experiments (red and green symbols) where cholesterol was delivered by cyclodextrin complexes (cholesterol/MCD, see Figure 4) and one experiment (black symbols) where cholesterol was delivered by β-VLDL (see Figure 5). For each experiment, the amount of nuclear SREBP-2 at zero time was normalized to 100%. Approximately 108 cells (from ten 10-cm dishes) were used for each data point. Circles denote data from CHO-7 cells (normal Insig-1 content); triangles denote data from CHO/pInsig1-Myc cells (increased Insig-1 content). The solid lines represent a best-fit of the experimental data to the Hill equation as described in Experimental Procedures. The best-fit values with 95% confidence intervals for cholesterol concentration (mol%) corresponding to 50% inhibition of SREBP-2 processing and the Hill coefficient were 5.5% ± 0.74% and 5.1 ± 0.36, respectively, for CHO-7 cells, and 3.1% ± 0.24% and 6.9 ± 0.48, respectively, for CHO/pInsig1-Myc cells.
Figure 7
Figure 7. Cholesterol Homeostasis – A Delicate Balance
ER cholesterol levels are tuned to the overall cholesterol content of cells. When cellular cholesterol levels are low, ER cholesterol concentration is below a threshold value (<5 mol%). Under these conditions, Scap escorts SREBPs from ER to Golgi by binding to Sec24, a component of the Sar1/Sec23/Sec24 complex of the CopII protein coat. Once in the Golgi, the SREBPs are proteolytically processed to generate their nuclear forms that activate genes for cholesterol synthesis and uptake. When cellular cholesterol levels are no longer limiting, ER cholesterol concentration rises above a threshold value (>5 mol%). Under these conditions, cholesterol binds to Scap, initiating its binding to Insig, an ER retention protein. This interaction prevents the hexapeptide sorting signal (MELADL) in Scap from binding to CopII proteins, blocking transport of SREBPs to Golgi and thus preventing its subsequent proteolytic cleavage and transcriptional activation. Cholesterol levels are critically balanced by this sharp switch. The concentration of ER cholesterol that defines the tip of the fulcrum (~5 mol%) is set by the ratio of Scap to Insig. Upper half of schematic diagram adapted from Sun, et al. (2007); lower half from data in current paper.

Comment in

  • A cholesterol toggle switch.
    Hampton RY. Hampton RY. Cell Metab. 2008 Dec;8(6):451-3. doi: 10.1016/j.cmet.2008.11.006. Cell Metab. 2008. PMID: 19041760

References

    1. Adams CM, Reitz J, DeBrabander JK, Feramisco JD, Brown MS, Goldstein JL. Cholesterol and 25-hydroxycholesterol inhibit activation of SREBPs by different mechanisms, both involving SCAP and Insigs. J Biol Chem. 2004;279:52772–52780. - PubMed
    1. Balch WE, Rothman JE. Characterization of protein transport between successive compartments of the Golgi apparatus: Asymmetric properties of donor and acceptor activities in a cell-free system. Arch Biochem Biophysics. 1985;240:413–425. - PubMed
    1. Bergstrand A, Dallner G. Isolation of rough and smooth microsomes from rat liver by means of a commercially available centrifuge. Analytical Biochem. 1969;29:351–356. - PubMed
    1. Bligh EG, Dyer WJ. A rapid method of total lipid extraction and purification. Can J Biochem Physiol. 1959;37:911–917. - PubMed
    1. Brown AJ, Sun L, Feramisco JD, Brown MS, Goldstein JL. Cholesterol addition to ER membranes alters conformation of SCAP, the SREBP escort protein that regulates cholesterol metabolism. Mol Cell. 2002;10:237–245. - PubMed

Publication types

Substances