. 2008 Dec;8(6):532-9.
doi: 10.1016/j.cmet.2008.11.002.

Glucose sensing in L cells: a primary cell study

Affiliations

Glucose sensing in L cells: a primary cell study

Frank Reimann et al. Cell Metab. 2008 Dec.

Abstract

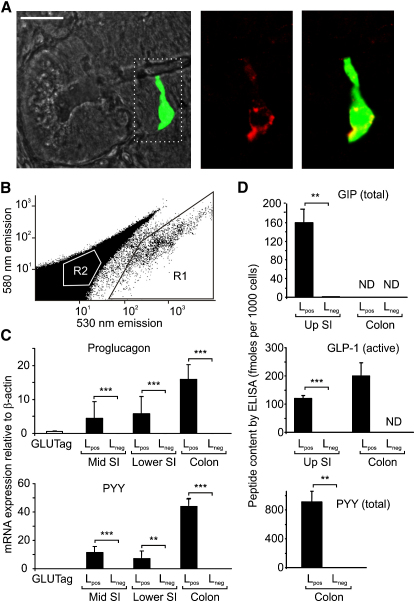
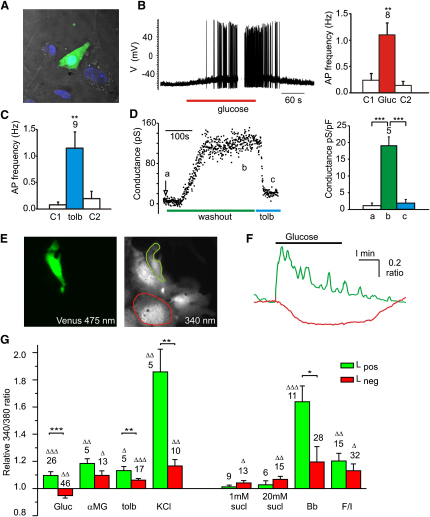
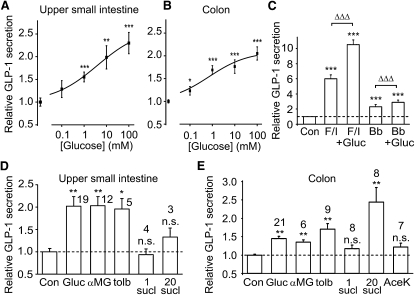
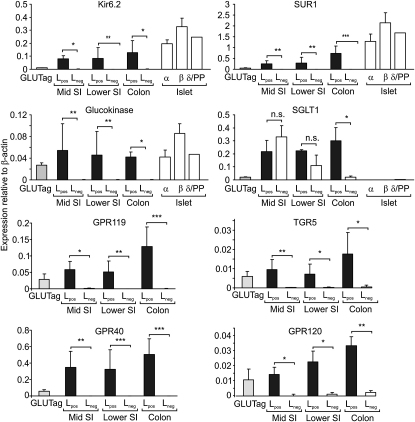
Glucagon-like peptide-1 (GLP-1) is an enteric hormone that stimulates insulin secretion and improves glycaemia in type 2 diabetes. Although GLP-1-based treatments are clinically available, alternative strategies to increase endogenous GLP-1 release from L cells are hampered by our limited physiological understanding of this cell type. By generating transgenic mice with L cell-specific expression of a fluorescent protein, we studied the characteristics of primary L cells by electrophysiology, fluorescence calcium imaging, and expression analysis and show that single L cells are electrically excitable and glucose responsive. Sensitivity to tolbutamide and low-millimolar concentrations of glucose and alpha-methylglucopyranoside, assessed in single L cells and by hormone secretion from primary cultures, suggested that GLP-1 release is regulated by the activity of sodium glucose cotransporter 1 and ATP-sensitive K(+) channels, consistent with their high expression levels in purified L cells by quantitative RT-PCR. These and other pathways identified using this approach will provide exciting opportunities for future physiological and therapeutic exploration.


Figures

Figure 1
Figure 1
Cell-Specific Venus Expression in Transgenic Mice (A) Colocalization of Venus fluorescence (green) with glucagon immunofluorescence (red) in the small intestine. Scale bar, 20 μm. (B) L cells were collected by FACS sorting with gates on pulse width, side and forward scatter to select single cells and yellow (580 nm) and green (530 nm) fluorescence to select Venus-positive (R1) or Venus-negative (R2) cells (excitation 488 nm). The figure shows a representative sort from the small intestine. (C) Relative expression of proglucagon and Pyy mRNAs in GLUTag cells and Lpos and Lneg cells from different regions of the intestine (middle third of small intestine [mid S1], lower third of small intestine [lower S1], and colon). Data are presented as geometric mean and upper SE (n ≥ 3 each). ∗∗p < 0.01, ∗∗∗p < 0.001 by Student's t test. (D) GIP, GLP-1, and PYY peptide contents in Lpos and Lneg cells from the small intestine (upper half, Up SI) or colon, as indicated, collected by FACS sorting and measured by ELISA. Data represent mean and SE of ≥ 3 samples with statistical comparisons between corresponding Lpos and Lneg cells. ∗∗p < 0.01, ∗∗∗p < 0.001. ND, not detected.
Figure 2
Figure 2
Electrical Activity and [Ca2+]i in Cultured Colonic L Cells (A) Colonic epithelial cells fixed after 10 days in primary culture. DIC, DAPI (blue), Venus (green). (B) Glucose-triggered electrical activity in L cells. (Left) Representative whole-cell perforated patch current clamp recording of a Venus-positive cell stimulated with glucose (10 mM) applied as indicated. (Right) Average action potential frequency before (C1), during (Gluc), and after (C2) application of glucose measured in eight cells. Error bars represent 1 SE and significance, between AP-frequency in the presence and absence of glucose was tested by Student's paired t test. ∗∗p < 0.01. (C) Average action potential frequency before (C1), during (tolb), and after (C2) application of tolbutamide (500 μM) measured in nine cells, as in (B). Error bars represent 1 SE, and significance between AP-frequency in the presence and absence of tolbutamide was tested by Student's paired t test. ∗∗p < 0.01. (D) Functional KATP wash-out currents in cultured L cells. (Left) Slope conductances between −70 and −50 mV were recorded from a cell in conventional whole-cell voltage clamp. The arrow indicates the time when the cell attached mode was converted into conventional whole cell with 300 μM ATP in the pipette. Tolbutamide (tolb, 500 μM) was applied at steady state, as indicated. (Right) Average conductances measured as exemplified on the left in five cells at times (a) cell attached, (b) wash-out steady state, and (c) after application of tolbutamide. Error bars represent 1 SE, and significance was tested by Student's paired t test. ∗∗∗p < 0.001. (E) Lpos and Lneg cells in colonic cultures were loaded with fura2-AM and identified by their presence/absence of Venus fluorescence (475 nm excitation, left). The image of fura2-loaded cells excited at 340 nm (right) was used to outline Lpos (green) and Lneg (red) cells. (F) The 340/380 nm fluorescence ratios (reflecting [Ca2+]i) of the two cells outlined in (E) are shown following addition of 10 mM glucose to the perfusate. Green trace, Lpos cell; red trace, Lneg cell. (G) Mean calcium changes in Lpos (green bars) and Lneg (red bars) cells, identified and monitored as in (E) and (F), following the addition of glucose (Gluc, 10 mM), αMG (10 mM), tolbutamide (tolb, 100 μM), KCl (30 mM), sucralose (sucl, 1 or 20 mM), bombesin (Bb, 100 nM), and forskolin/IBMX (F/I, 10 μM of each), as indicated. 340/380 ratios in the presence of the test agent were normalized to the mean of the background ratios of each cell measured before addition and after washout of the test compound. Data represent the mean and SE of the number of cells indicated above each bar. Δp < 0.05, ΔΔp < 0.01, and ΔΔΔp < 0.001 compared with baseline. p < 0.05, ∗∗p < 0.01, and ∗∗∗p < 0.001 for comparison between corresponding Lpos and Lneg cells by Student's t test.
Figure 3
Figure 3
GLP-1 Secretion from Primary Intestinal Cultures (A and B) Mixed primary cultures from the upper half of the small intestine (A) or the colon (B) were incubated in bath solution containing the glucose concentrations indicated. The percentage of GLP-1 secretion in each well is expressed relative to the basal secretion measured in parallel on the same day. Dose-response curves were fitted through the entire data set using a logistic equation, giving EC50s of 4 mM and 0.7 mM for the small intestine and colon, respectively (not significantly different). Error bars represent 1 SE, and significance is shown relative to baseline using a single-factor t test. p < 0.05, ∗∗p < 0.01, ∗∗∗p < 0.001. (C) GLP-1 secretion from primary colonic cultures triggered by forskolin/IBMX (F/I, 10 μM of each), bombesin (Bb, 100 nM), or glucose (Gluc, 10 mM), as indicated, measured and expressed as in (A). Error bars represent 1 SE, and significance is shown relative to baseline using a single-factor t test: ∗∗∗p < 0.001. The additional effect of glucose was analyzed by regression analysis to compensate for variation in the effectiveness of forskolin/IBMX or bombesin between different experiments: ΔΔΔp < 0.001. (D and E) GLP-1 secretion from the upper small intestine (D) or colon (E), measured as in (A), following addition of glucose (Gluc, 10 mM), αMG (10 mM), tolbutamide (tolb, 500 μM), sucralose (sucl, 1 or 20 mM), or acesulfame K (AceK, 2 mM). The control bar (Con) and dashed line indicate the basal rate of secretion. Data represent the mean and SE of the number of wells indicated, and significance is shown relative to baseline, tested by a single-factor t test. p < 0.05, ∗∗ p < 0.01. n.s., not significant.
Figure 4
Figure 4
Expression Analysis Expression of the genes indicated in GLUTag cells, Lpos cells, and Lneg cells from three different regions of the gut (middle third of small intestine [SI], lower third of small intestine, and colon) and in pancreatic α, β, and δ/PP cells isolated as in Figure S2. Expression was normalized to that of β-actin in the same sample. Data are presented as geometric mean and upper SE (n ≥ 3 each). Lpos and Lneg cells were compared by Student's t tests: p < 0.05, ∗∗p < 0.01, ∗∗∗p < 0.001. n.s., not significant.

Comment in

References

    1. Abello J., Ye F., Bosshard A., Bernard C., Cuber J.C., Chayvialle J.A. Stimulation of glucagon-like peptide-1 secretion by muscarinic agonist in a murine intestinal endocrine cell line. Endocrinology. 1994;134:2011–2017. - PubMed
    1. Brubaker P.L., Vranic M. Fetal rat intestinal cells in monolayer culture: a new in vitro system to study the glucagon-like immunoreactive peptides. Endocrinology. 1987;120:1976–1985. - PubMed
    1. Bufler J., Choi G.C., Franke C., Schepp W., Prinz C. Voltage-gated Ca2+ currents in rat gastric enterochromaffin-like cells. Am. J. Physiol. 1998;274:C424–C429. - PubMed
    1. Cani P.D., Holst J.J., Drucker D.J., Delzenne N.M., Thorens B., Burcelin R., Knauf C. GLUT2 and the incretin receptors are involved in glucose-induced incretin secretion. Mol. Cell. Endocrinol. 2007;276:18–23. - PubMed
    1. Chu Z.L., Carroll C., Alfonso J., Gutierrez V., He H., Lucman A., Pedraza M., Mondala H., Gao H., Bagnol D. A role for intestinal endocrine cell-expressed g protein-coupled receptor 119 in glycemic control by enhancing glucagon-like Peptide-1 and glucose-dependent insulinotropic Peptide release. Endocrinology. 2008;149:2038–2047. - PubMed

Publication types

LinkOut - more resources