. 2009 May;41(5):1216-27.
doi: 10.1016/j.biocel.2008.11.001. Epub 2008 Nov 12.

A novel adhesion molecule in human breast cancer cells: voltage-gated Na+ channel beta1 subunit

Affiliations

A novel adhesion molecule in human breast cancer cells: voltage-gated Na+ channel beta1 subunit

Athina-Myrto Chioni et al. Int J Biochem Cell Biol. 2009 May.

Abstract

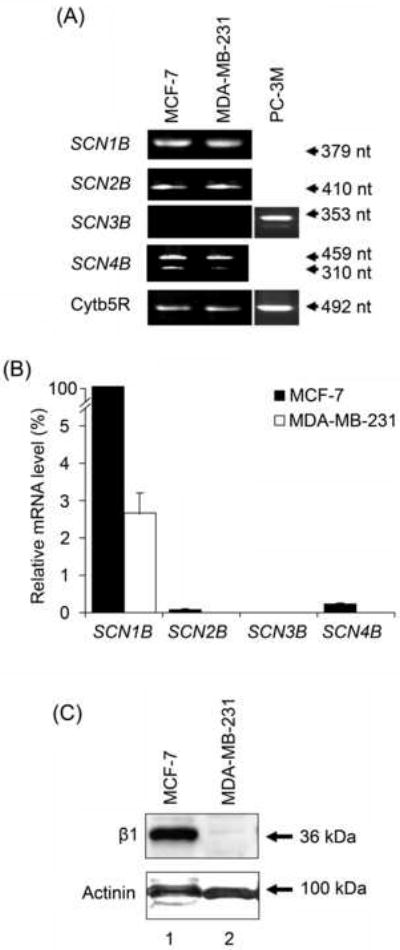
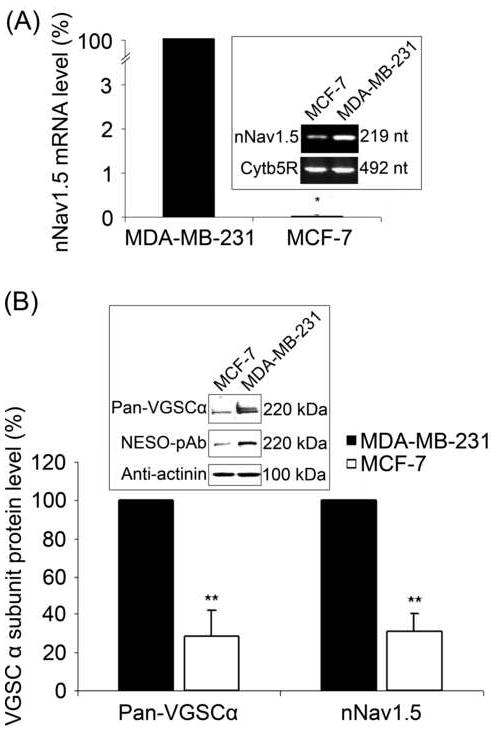
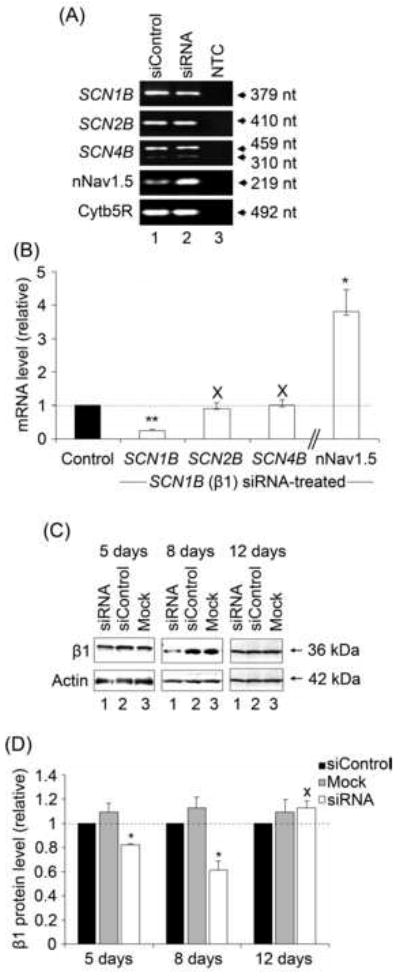
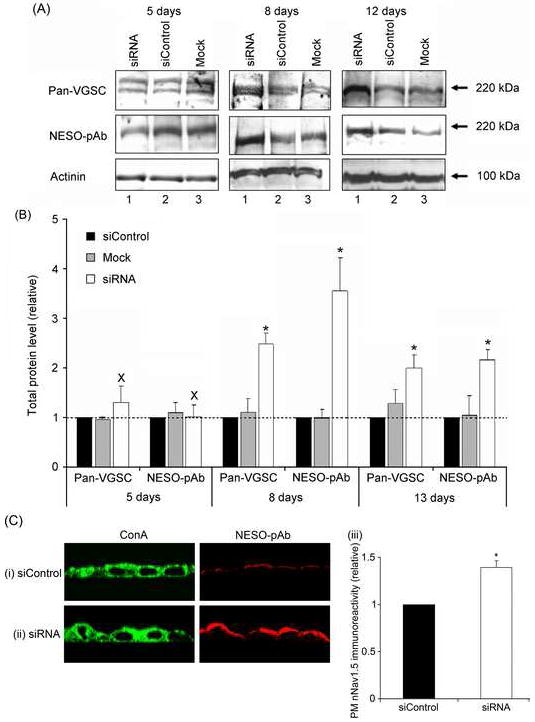
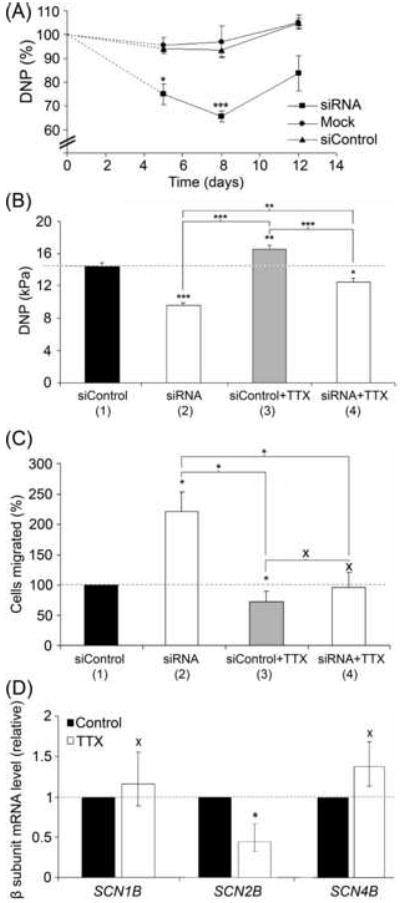
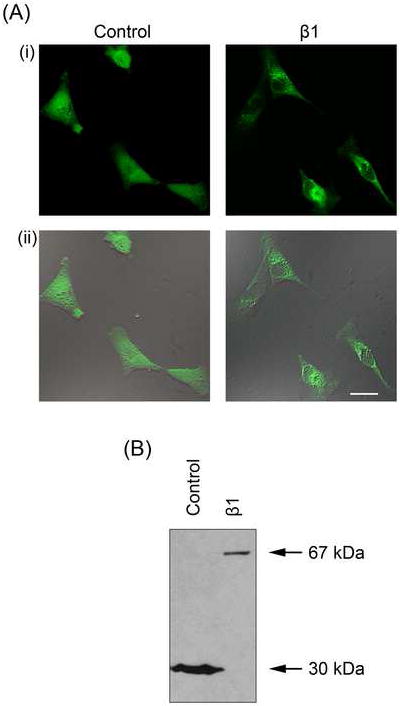
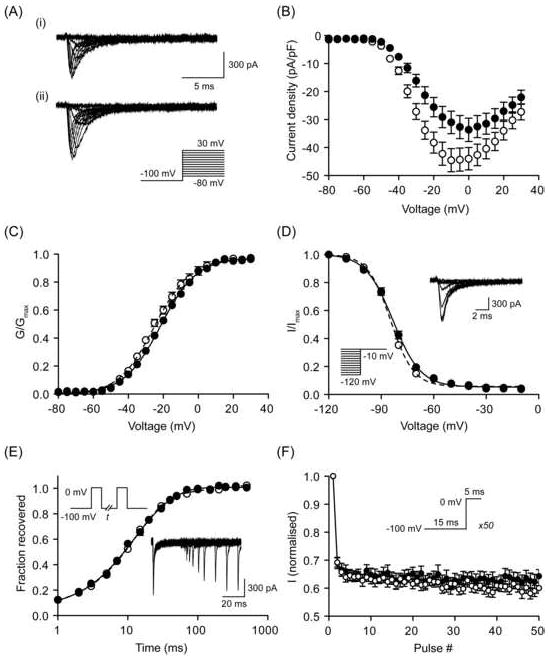
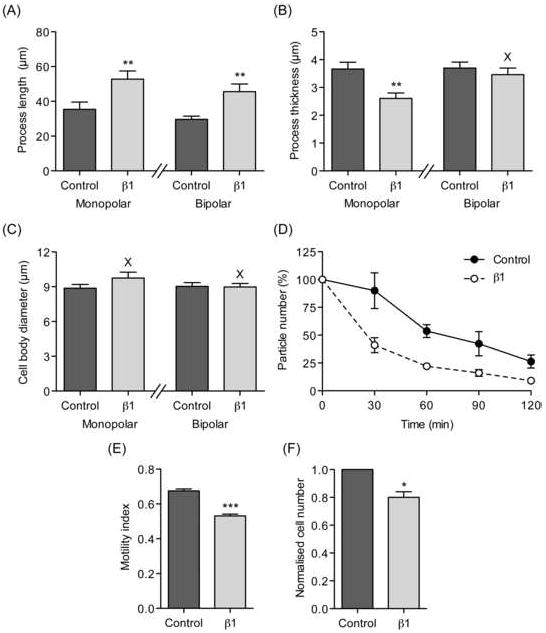
Voltage-gated Na(+) channels (VGSCs), predominantly the 'neonatal' splice form of Na(v)1.5 (nNa(v)1.5), are upregulated in metastatic breast cancer (BCa) and potentiate metastatic cell behaviours. VGSCs comprise one pore-forming alpha subunit and one or more beta subunits. The latter modulate VGSC expression and gating, and can function as cell adhesion molecules of the immunoglobulin superfamily. The aims of this study were (1) to determine which beta subunits were expressed in weakly metastatic MCF-7 and strongly metastatic MDA-MB-231 human BCa cells, and (2) to investigate the possible role of beta subunits in adhesion and migration. In both cell lines, the beta subunit mRNA expression profile was SCN1B (encoding beta1)>>SCN4B (encoding beta4)>SCN2B (encoding beta2); SCN3B (encoding beta3) was not detected. MCF-7 cells had much higher levels of all beta subunit mRNAs than MDA-MB-231 cells, and beta1 mRNA was the most abundant. Similarly, beta1 protein was strongly expressed in MCF-7 and barely detectable in MDA-MB-231 cells. In MCF-7 cells transfected with siRNA targeting beta1, adhesion was reduced by 35%, while migration was increased by 121%. The increase in migration was reversed by tetrodotoxin (TTX). In addition, levels of nNa(v)1.5 mRNA and protein were increased following beta1 down-regulation. Stable expression of beta1 in MDA-MB-231 cells increased functional VGSC activity, process length and adhesion, and reduced lateral motility and proliferation. We conclude that beta1 is a novel cell adhesion molecule in BCa cells and can control VGSC (nNa(v)1.5) expression and, concomitantly, cellular migration.


Figures

Figure 1
Figure 1. β subunit expression in MCF-7 and MDA-MB-231 cells
(A) Typical gel images of PCR products, taken at the end of the PCR, for SCN1B, SCN2B, SCN3B, SCN4B and cytochrome b5-reductase (Cytb5R) from MCF-7, MDA-MB-231 and PC-3M cells. The PC-3M cell line was used as a positive control for SCN3B expression (Diss et al., 2007). (B) Relative mRNA levels of SCN1B, SCN2B, SCN3B and SCN4B, normalised to Cytb5R by the 2-ΔΔCt method, and expressed as a percentage of the SCN1B mRNA level in MCF-7 cells (fixed as 100 %). Each histobar indicates mean + error propagated through the 2-ΔΔCt analysis (n = 3). Significance is shown in Table 1. (C) Western blot with 70 μg of total protein per lane from MCF-7 and MDA-MB-231 cells, using β1ex and an actinin antibody as a control for loading. The same membrane was stripped and re-blotted.
Figure 2
Figure 2. Expression of nNav1.5 mRNA and protein in MCF-7 and MDA-MB-231 cells
(A) Relative mRNA levels of nNav1.5, normalised to cytochrome b5-reductase (Cytb5R) by the 2-ΔΔCt method, and expressed as a percentage of the level in MDA-MB-231 cells (fixed as 100 %). Errors are propagated through the 2-ΔΔCt analysis (n = 4). Inset, typical gel images of nNav1.5 and Cytb5R real-time PCR products, taken at the end of the PCR. (B) Relative nNav1.5 and total VGSC α subunit protein levels in MDA-MB-231 and MCF-7 cells. For each antigen, the expression level in MDA-MB-231 cells was fixed as 100 %. The signal from NESO-pAb or pan-α subunit antibodies was normalised to the actinin control. Inset, Western blot with 60 μg of total protein per lane from MCF-7 and MDA-MB-231 cells, using NESO-pAb, pan-VGSC α subunit antibody, and actinin antibody as a control for loading. The same membrane was stripped and re-blotted. Each histobar indicates mean + SEM (n = 6). Significance: (*) P < 0.05, (**) P < 0.01; Mann-Whitney Rank Sum test.
Figure 3
Figure 3. Effects of silencing SCN1B on VGSC expression in MCF-7 cells
(A) Typical gel images of PCR products, taken at the end of the PCR, for SCN1B, SCN2B, SCN4B, nNav1.5 and cytochrome-b5 reductase (Cytb5R) from MCF-7 cells 4 days after transfection with siControl (lane 1), or siRNA targeting SCN1B (lane 2). NTC (lane 3), no-template controls for PCR amplification. (B) Relative (%) mRNA levels of SCN1B, SCN2B, SCN4B and nNav1.5. Control (black bar – 100 %): MCF-7 cells treated with siControl non-targeting RNAi; white bars: MCF-7 cells treated with siRNA targeting SCN1B. β subunit and nNav1.5 mRNA levels were normalised to Cytb5R by the 2-ΔΔCt method. Errors are propagated through the 2-ΔΔCt analysis (n = 3). (C) Western blots with 70 μg of total protein per lane from cells 5, 8 and 12 days after treatment. For each case, lane 1, treatment with ‘mock’ control (no siRNA); lane 2, treatment with non-targeting siControl siRNA; and lane 3, treatment with siRNA targeting SCN1B. The β1ex antibody and an anti-actin antibody were used for β1 and for loading control, respectively (the same membrane was stripped and re-blotted). (D) Quantification of the data shown in (C). Relative total β1 protein levels were normalised to the actin control. Data are presented as mean and SEM (n ≥ 4). Significance: (X) P >0.05; (*) P < 0.05; (**) P < 0.01; ANOVA with Newman-Keuls (B), Student’s paired t-test (D).
Figure 4
Figure 4. Effect of RNAi targeting SCN1B on the nNav1.5 protein level in MCF-7 cells
(A) Western blots with 80 μg of total protein per lane from cells 5, 8 and 12 days after treatment. For each case, lane 1, treatment with ‘mock’ control (no siRNA); lane 2, treatment with non-targeting siControl siRNA; and lane 3, treatment with siRNA targeting SCN1B. Antibodies used were pan-VGSC (for total VGSC), NESO-pAb for nNav1.5 and an actinin antibody for loading control. The same membrane was stripped and re-blotted. (B) Quantification of the data shown in (A). Relative total VGSC α subunit and nNav1.5 protein levels normalised to the actinin control. (C) Typical confocal XZY images of non-permeablised MCF-7 cells 8 days after transfection with (i) non-targeting siControl siRNA or (ii) siRNA targeting SCN1B double-immunolabelled with conA plasma membrane marker (left) and NESO-pAb (right); (iii), Relative peripheral nNav1.5 level, measured from the confocal XZY images. Data are presented as mean and SEM [(B), n = 4; (C), n = 3]. Significance: (*) P < 0.05; (B), ANOVA with Newman-Keuls; (C) Student’s paired t-test.
Figure 5
Figure 5. Effects of β1 downregulation on adhesion and migration of MCF-7 cells
(A) Time-course of reduction in relative detachment negative pressure (DNP) of MCF-7 cells following transfection with siRNA targeting SCN1B. Circles, ‘mock’ control (without siRNA); triangles, siControl non-targeting siRNA; squares, siRNA targeting SCN1B. (B) Absolute DNP values (in kPa) of MCF-7 cells 8 days after transfection with siControl non-targeting siRNA (bar 1) or siRNA targeting SCN1B (bar 2). In a separate experiment, cells were pre-treated with TTX (10 μM for 48 h), continued during the assay for cells transfected with siControl non-targeting siRNA (bar 3) or siRNA targeting β1(bar 4). (C) Relative number of cells migrating through a Transwell chamber over 12 h, 8 days after transfection with siControl non-targeting siRNA (bar 1) or siRNA targeting SCN1B (bar 2). In a separate experiment, cells were pre-treated with TTX (10 μM for 48 h), continued during the assay for cells transfected with siControl non-targeting siRNA (bar 3) or siRNA targeting SCN1B (bar 4). (D) Relative mRNA levels of SCN1B, SCN2B AND SCN4B in MCF-7 cells after 48 hours treatment with/without TTX (10 μM), normalised to cytochrome b5-reductase (Cytb5R) by the 2-ΔΔCt method. Errors are propagated through the 2-ΔΔCt analysis (n = 3). Data in (A), (B) and (C) are presented as mean ± SEM (n ≥ 3). Significance: (X) P > 0.05; (*) P < 0.05, (**) P < 0.01, (***) P < 0.001; (A), (B), (C) ANOVA with Newman-Keuls; (D) Student’s paired t-test.
Figure 6
Figure 6. Stably expressing MDA-MB-231 cell lines
(A) Typical confocal XY (i) and merged bright-field images (ii) of MDA-MB-231 cells stably transfected with eGFP (‘Control’) and β1 with an eGFP C-terminal fusion (‘β1’). (B) Western blot of protein from MDA-MB-231 cells stably transfected with eGFP (‘Control’; total cell lysate) and β1 with an eGFP C-terminal fusion (‘β1’; membrane preparation) using an anti-GFP antibody. eGFP, 30 kDa; β1-eGFP, 67 kDa.
Figure 7
Figure 7. Effect of β1 on VGSC activity in MDA-MB-231 cells
(A) Typical whole-cell Na+ currents elicited by 60 ms depolarizing voltage pulses between -80 mV and +30 mV applied from a holding potential of -100 mV: (i) a control cell expressing eGFP; (ii) a cell expressing β1-eGFP. (B) Current-voltage relationship. Peak Na+ current density was plotted as a function of voltage for control cells expressing eGFP (filled circles) and cells expressing β1-eGFP (open circles). (C) Activation. Normalised conductance (G/Gmax), calculated from the current data, plotted as a function of voltage for control cells expressing eGFP (filled circles) and cells expressing β1-eGFP (open circles). (D) Steady-state inactivation. Normalised current (I/Imax), elicited by 60 ms test pulses at - 10 mV following 1 s conditioning voltage pulses between -120 and -10 mV, applied from a holding potential of -100 mV, plotted as a function of the prepulse voltage for control cells expressing eGFP (filled circles) and cells expressing β1-eGFP (open circles). Inset, typical recording from a control cell. (E) Recovery from inactivation. The fraction recovered (It/I0) was determined by a 25 ms pulse to 0 mV (I0), followed by a recovery pulse to -100 mV for 1-500 ms, and a subsequent 25 ms test pulse to 0 mV (It), applied from a holding potential of -100 mV, and plotted as a function of the recovery interval for control cells expressing eGFP (filled circles) and cells expressing β1-eGFP (open circles). Inset, typical recording from a control cell. (F) Use-dependent rundown. Current (I), elicited by 50 Hz pulse trains to 0 mV, applied from a holding potential of-100 mV, normalised to the current evoked by the first pulse plotted as a function of the pulse number for control cells expressing eGFP (filled circles) and cells expressing β1-eGFP (open circles). Control (solid lines) and β1-eGFP (dashed lines) data are fitted with Boltzmann functions, (C) and (D); and double exponential functions, (E). Data are presented as mean ± SEM (n = 20).
Figure 8
Figure 8. Effects of β1 on morphology, adhesion, migration and proliferation of MDA-MB-231 cells
(A) Process length of MDA-MB-231 cells stably transfected with eGFP (‘Control’) and β1 with eGFP C-terminal fusion (‘β1’). (B) Process thickness of MDA-MB-231 cells stably transfected with eGFP (‘Control’) and β1 with eGFP C-terminal fusion (‘β1’). (C) Cell body diameter of MDA-MB-231 cells stably transfected with eGFP (‘Control’) and β1 with eGFP C-terminal fusion (‘β1’). In (A), (B) and (C), cells were defined as having monopolar or bipolar morphologies and analysed separately (n = 40). (D) Cell-cell adhesion. Single MDA-MB-231 cells stably transfected with eGFP (‘Control’) and β1 with eGFP C-terminal fusion (‘β1’) were incubated with gentle agitation for 2 h. The number of particles was monitored every 30 min and expressed as a percentage of the starting value. As cells adhered to one-another and formed aggregates, the particle number decreased (n = 3 repeat experiments). (E) Motility index (MI) of MDA-MB-231 cells stably transfected with eGFP (‘Control’) and β1 with eGFP C-terminal fusion (‘β1’) in a wound-heal assay. Wound width was measured at 0 h (W0) and 24 h (Wt). MI was calculated as 1 – (Wt/W0) (n = 135). (F) Proliferation of MDA-MB-231 cells stably transfected with eGFP (‘Control’) and β1 with eGFP C-terminal fusion (‘β1’), normalised relative to control. Cells were grown for 24 h and counted using the MTT assay (n = 3 repeat experiments). Data are presented as mean ± SEM. Significance: (X) P > 0.05; (*) P < 0.05, (**) P < 0.01, (***) P < 0.001; (A), (B), (C), (E) Student’s t-test; (F) Student’s paired t-test.

References

    1. Adachi K, Toyota M, Sasaki Y, Yamashita T, Ishida S, Ohe-Toyota M, Maruyama R, Hinoda Y, Saito T, Imai K, Kudo R, Tokino T. Identification of SCN3B as a novel p53-inducible proapoptotic gene. Oncogene. 2004;23:7791–7798. - PubMed
    1. Allen DH, Lepple-Wienhues A, Cahalan MD. Ion channel phenotype of melanoma cell lines. J Membr Biol. 1997;155:27–34. - PubMed
    1. An RH, Wang XL, Kerem B, Benhorin J, Medina A, Goldmit M, Kass RS. Novel LQT-3 mutation affects Na+ channel activity through interactions between alpha-and beta1-subunits. Circ Res. 1998;83:141–146. - PubMed
    1. Armstrong CM, Bezanilla F. Inactivation of the sodium channel. II. Gating current experiments. J Gen Physiol. 1977;70:567–590. - PMC - PubMed
    1. Bennett ES, Smith BA, Harper JM. Voltage-gated Na+ channels confer invasive properties on human prostate cancer cells. Pflugers Arch. 2004;447:908–914. - PubMed

Publication types