

Tract-based analysis of magnetization transfer ratio and diffusion tensor imaging of the frontal and frontotemporal connections in schizophrenia
- PMID: 19042913
- PMCID: PMC2894583
- DOI: 10.1093/schbul/sbn161
Tract-based analysis of magnetization transfer ratio and diffusion tensor imaging of the frontal and frontotemporal connections in schizophrenia
Abstract
Background: In the pathophysiology of schizophrenia, aberrant connectivity between brain regions may be a central feature. Diffusion tensor imaging (DTI) studies have shown altered fractional anisotropy (FA) in white brain matter in schizophrenia. Focal reductions in myelin have been suggested in patients using magnetization transfer ratio (MTR) imaging but to what extent schizophrenia may be related to changes in MTR measured along entire fiber bundles is still unknown.
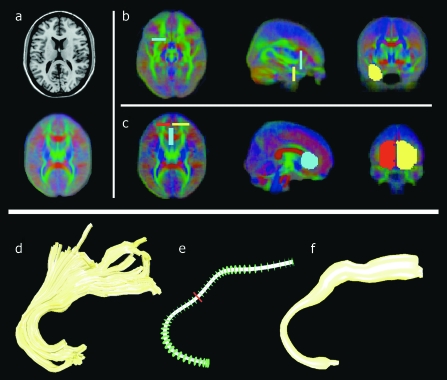
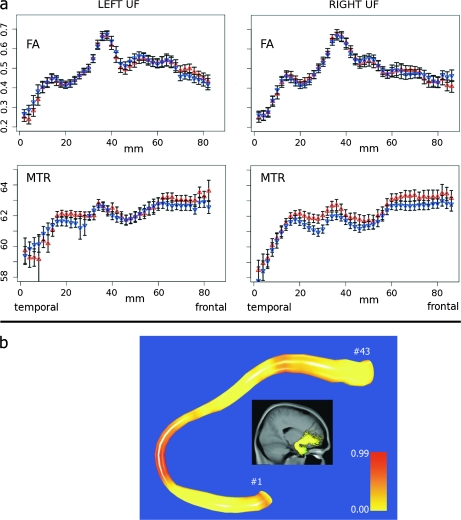
Methods: DTI and MTR images were acquired with a 1.5-T scanner in 40 schizophrenia patients and compared with those of 40 healthy participants. The mean FA and mean MTR were measured along the genu of the corpus callosum and the left and right uncinate fasciculus.
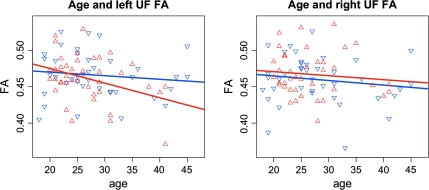
Results: A higher mean MTR of 1% was found in the right uncinate fasciculus in patients compared with healthy participants. A significant negative correlation between age and mean FA in the left uncinate fasciculus was found in schizophrenia patients but not in healthy participants.
Conclusions: Decreased FA in the left uncinate fasciculus may be more prominent in patients with longer illness duration. The increased mean MTR in the right uncinate fasciculus could reflect a compensatory role for myelin in these fibers or possibly represent aberrant frontotemporal connectivity.
Figures
Similar articles
-
Tract-specific analysis of white matter integrity disruption in schizophrenia.Psychiatry Res. 2012 Feb 28;201(2):136-43. doi: 10.1016/j.pscychresns.2011.07.010. Epub 2012 Mar 6. Psychiatry Res. 2012. PMID: 22398298
-
White matter abnormalities associated with auditory hallucinations in schizophrenia: a combined study of voxel-based analyses of diffusion tensor imaging and structural magnetic resonance imaging.Psychiatry Res. 2007 Nov 15;156(2):93-104. doi: 10.1016/j.pscychresns.2007.02.002. Epub 2007 Sep 19. Psychiatry Res. 2007. PMID: 17884391
-
Uncinate fasciculus fiber tracking in mesial temporal lobe epilepsy. Initial findings.Eur Radiol. 2007 Jul;17(7):1663-8. doi: 10.1007/s00330-006-0558-x. Epub 2007 Jan 12. Eur Radiol. 2007. PMID: 17219141
-
White matter connectivity in bipolar disorder.Int Rev Psychiatry. 2009;21(4):380-6. doi: 10.1080/09540260902962172. Int Rev Psychiatry. 2009. PMID: 20374151 Review.
-
Diffusion tensor imaging in schizophrenia.Eur Psychiatry. 2008 Jun;23(4):255-73. doi: 10.1016/j.eurpsy.2007.12.004. Epub 2008 Jun 4. Eur Psychiatry. 2008. PMID: 18524546 Review.
Cited by
-
Multimodal assessment of white matter microstructure in antipsychotic-naïve schizophrenia patients and confounding effects of recreational drug use.Brain Imaging Behav. 2021 Feb;15(1):36-48. doi: 10.1007/s11682-019-00230-4. Brain Imaging Behav. 2021. PMID: 31909444
-
Mapping Theme Trends and Knowledge Structure of Magnetic Resonance Imaging Studies of Schizophrenia: A Bibliometric Analysis From 2004 to 2018.Front Psychiatry. 2020 Feb 7;11:27. doi: 10.3389/fpsyt.2020.00027. eCollection 2020. Front Psychiatry. 2020. PMID: 32116844 Free PMC article.
-
Radiomic tractometry reveals tract-specific imaging biomarkers in white matter.Nat Commun. 2024 Jan 5;15(1):303. doi: 10.1038/s41467-023-44591-3. Nat Commun. 2024. PMID: 38182594 Free PMC article.
-
Aberrations in the arcuate fasciculus are associated with auditory verbal hallucinations in psychotic and in non-psychotic individuals.Hum Brain Mapp. 2013 Mar;34(3):626-34. doi: 10.1002/hbm.21463. Epub 2011 Nov 23. Hum Brain Mapp. 2013. PMID: 22109992 Free PMC article.
-
A functional and structural investigation of the human fronto-basal volitional saccade network.PLoS One. 2012;7(1):e29517. doi: 10.1371/journal.pone.0029517. Epub 2012 Jan 3. PLoS One. 2012. PMID: 22235303 Free PMC article.
References
-
- Wright P, Nimgaonkar VL, Donaldson PT, Murray RM. Schizophrenia and HLA: a review. Schizophr Res. 2001;47:1–12. - PubMed
-
- Bleuler E. Dementia Praecox or the Group of Schizophrenias. NewYork, NY: International Universities Press; 1911.
-
- Kraepelin E. Dementia Praecox and Paraphrenia. 8th ed. Edinburgh, UK: Livingstone; 1919.
-
- Davis KL, Stewart DG, Friedman JI, et al. White matter changes in schizophrenia—evidence for myelin-related dysfunction. Arch Gen Psychiatry. 2003;60:443–456. - PubMed
-
- Beaulieu C. The basis of anisotropic water diffusion in the nervous system—a technical review. NMR Biomed. 2002;15:435–455. - PubMed
Publication types
MeSH terms
LinkOut - more resources
Full Text Sources
Medical
