. 2008 Dec;10(12):1379-82.
doi: 10.1038/ncb1208-1379.

Do the protocadherins Fat and Dachsous link up to determine both planar cell polarity and the dimensions of organs?

Affiliations

Do the protocadherins Fat and Dachsous link up to determine both planar cell polarity and the dimensions of organs?

Peter A Lawrence et al. Nat Cell Biol. 2008 Dec.

Abstract

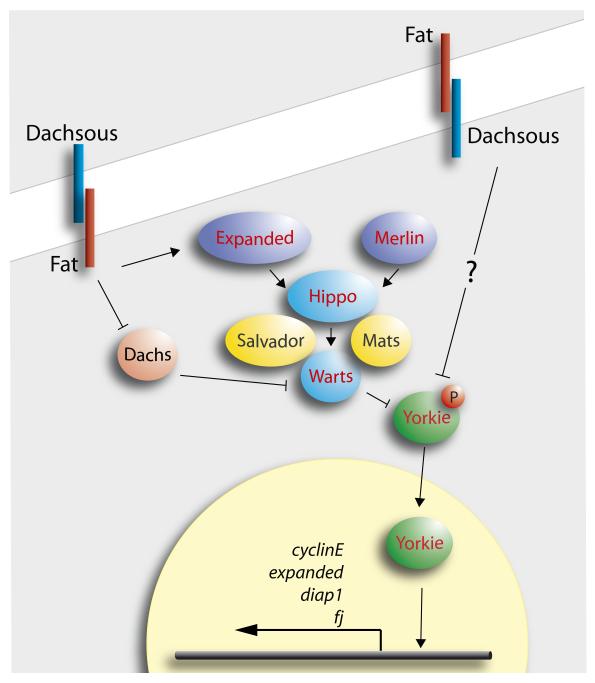
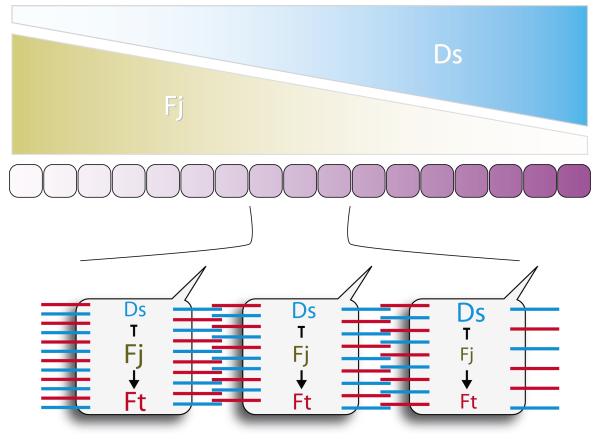
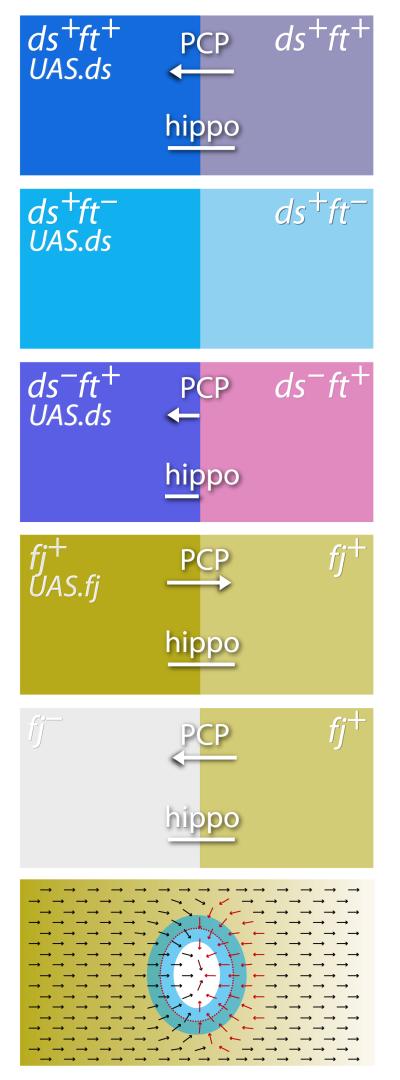
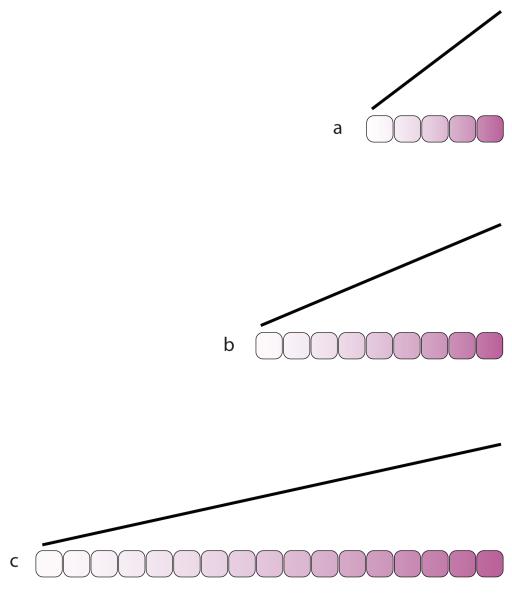
Most, perhaps all cells in epithelial sheets are polarized in the plane of the sheet. This type of polarity, referred to as planar cell polarity (PCP), can be expressed in the orientation of cilia and stereocilia, in oriented outgrowths such as hairs, in the plane of cell division, in directed cell movement and possibly in the orientation of axon extension. Another popular area in current research is growth: there is an attempt to find systems that fix the shape and size of organs. Although both polarity and growth are subject to overall control by morphogen gradients, the mechanisms of this control are almost completely unknown. Here we discuss recent evidence for a 'steepness hypothesis' that links these two apparently disconnected features of animal development.


Figures

Figure 1
Figure 1
The Hippo pathway, see REF. . Note it is not clear how Ft and Ds feed into the pathway, but we imagine the input within one cell to be from both types of Ft/Ds heterodimers in the membrane. Warts is thought to regulate the phosphorylation of the transcription factor Yorkie; unphosphorylated Yorkie enters the nucleus and drives transcription of target genes.
Figure 2
Figure 2
A sketch of the Ds/Ft model. There is evidence that the Ds and Fj gradients are set up by the primary morphogens; they make a Ds/Ft gradient that is responsible for both PCP, and for the activation of Hippo targets that drive growth-. In the model, Ds and Fj concentration gradients span the organ and interact with uniformly expressed Ft molecules to build together, in one axis, a linear gradient of Ds/Ft heterodimers. Putative distributions of Ds and Ft heterodimers are indicated below. In the model, Ds and Ft function as trans-heterodimers acting, in effect, as ligands and receptors for each other. This model explains, for example, why ds or ft cells do not show PCP or growth responses — ds or ft cells could not compare numbers of Ds/Ft heterodimers on their two faces.
Figure 3
Figure 3
The effects of juxtaposing cells with different levels or states of the Ds/Ft system. The left column shows the genotypes of clones and the right column the background genotypes — the interfaces between cells of these two genotypes drive the effects which produce coextensive outputs onto PCP and Hippo targets. The arrows show formally the sign as well as the extent of polarity effects that reverse the background polarity on the appropriate sides of the clones. The bars indicate the extent of upregulation of Hippo targets above background levels — these extend a few cell rows on one or both sides of the interfaces as shown, . Ft is indicated in pink, Ds in blue and Fj in cadmium green. Below we show a single example of an ellipsoidal fj clone. The clone is outlined with a dotted red line, the arrows indicate the PCP of oriented structures such as cuticular hairs, red arrows showing where polarity has been changed by the clone-induced Ds/Ft slopes. Blue marks the zone, including both the periphery of the clone and its surround, in which Hippo targets are upregulated as a result of local steepening of those slopes.
BOX 1 Figure
BOX 1 Figure
The gradient is assumed to be linear. As the organ grows, the maximum and minimum limits are conserved while recently divided cells take up intermediate scalar values from their neighbours (some evidence for this can be found in REF. 34). The steepness of the gradient at each point, measured perhaps as a differential across each cell, correlates with the dimension of the organ. A measure that, in principle, could be delivered locally to each cell. During normal growth and development, the identity of cells changes, so that the “target steepness” will vary from stage to stage. This process could be responsible for the observed and precise logarithmic increase in the length of organs, such as limbs, from instar to instar in hemimetabolic insects.

References

    1. Wang Y, Nathans J. Development. 2007;134:647–658. - PubMed
    1. Zallen JA. Cell. 2007;129:1051–1063. - PubMed
    1. Zecca M, Basler K, Struhl G. Development. 1995;121:2265–2278. - PubMed
    1. Lawrence PA. Adv. Insect Physiol. 1970;7:197–266.
    1. Lawrence PA. J. Exp. Biol. 1966;44:607–620. - PubMed

Publication types

LinkOut - more resources