. 2008 Nov;4(11):e1000277.
doi: 10.1371/journal.pgen.1000277. Epub 2008 Nov 28.

A PI3-kinase-mediated negative feedback regulates neuronal excitability

Affiliations

A PI3-kinase-mediated negative feedback regulates neuronal excitability

Eric Howlett et al. PLoS Genet. 2008 Nov.

Abstract

Use-dependent downregulation of neuronal activity (negative feedback) can act as a homeostatic mechanism to maintain neuronal activity at a particular specified value. Disruption of this negative feedback might lead to neurological pathologies, such as epilepsy, but the precise mechanisms by which this feedback can occur remain incompletely understood. At one glutamatergic synapse, the Drosophila neuromuscular junction, a mutation in the group II metabotropic glutamate receptor gene (DmGluRA) increased motor neuron excitability by disrupting an autocrine, glutamate-mediated negative feedback. We show that DmGluRA mutations increase neuronal excitability by preventing PI3 kinase (PI3K) activation and consequently hyperactivating the transcription factor Foxo. Furthermore, glutamate application increases levels of phospho-Akt, a product of PI3K signaling, within motor nerve terminals in a DmGluRA-dependent manner. Finally, we show that PI3K increases both axon diameter and synapse number via the Tor/S6 kinase pathway, but not Foxo. In humans, PI3K and group II mGluRs are implicated in epilepsy, neurofibromatosis, autism, schizophrenia, and other neurological disorders; however, neither the link between group II mGluRs and PI3K, nor the role of PI3K-dependent regulation of Foxo in the control of neuronal excitability, had been previously reported. Our work suggests that some of the deficits in these neurological disorders might result from disruption of glutamate-mediated homeostasis of neuronal excitability.


Conflict of interest statement

The authors have declared that no competing interests exist.

Figures

Figure 1
Figure 1. DmGluRA activity inhibits neuronal excitability via activation of the PI3K pathway.
The motor neuron GAL4 driver D42 was used to drive expression of all transgenes. For all LTF experiments, the bath solution contained 0.15 mM [Ca2+] and 100 µM quinidine, which is a K+ channel blocker that sensitizes the motor neuron and enables LTF to occur and measured even in hypoexcitable neurons. A) Representative traces showing the decreased rate of onset of long-term facilitation (LTF) (I) and decreased excitatory junction potential (ejp) amplitude (II) in larvae overexpressing PI3K-CAAX in motor neurons compared to wildtype at the indicated [Ca2+], and the increased rate of onset of LTF and ejp amplitude in larvae overexpressing PTEN. Arrowheads indicate the increased and asynchronous ejps, indicative of onset of LTF. In (II), ejps are averages of 180 responses for each genotype. B) Number of stimulations required to induce LTF (Y axis) at the indicated stimulus frequencies (X axis) in the indicated genotypes. Geometric means+/−SEMs are shown. From top to bottom, n = 6, 12, 7, 18, 12, 21, and 6 respectively, for each genotype. One-way ANOVA and Fisher's LSD gave the following differences, at 10 Hz, 7 Hz, 5 Hz and 3 Hz, respectively: For D42>+: vs. D42>PI3K-CAAX, p = 0.013, 0.0021, 0.0002, <0.0001; vs. D42>PTEN, p = 0.011, 0.056, 0.079, 0.0054; vs. D42>PTENRNAi, p = 0.0018, 0.0004, 0.0006, 0.0014; vs. D42>PI3KDN, p = 0.035, 0.036, 0.05, 0.038; vs. mGluR112b, p = 0.0012, 0.0005, 0.0004, 0.0009. For mGluR112b, D42>PI3K-CAAX vs: mGluR112b, p = 0.0003, <0.0001, <0.0001, <0.0001; vs. D42>PI3K-CAAX, p = 0.33, 0.34. 0.46, 0.62. C) Mean ejp amplitudes (Y axis) at the indicated [Ca2+] (X axis), from the indicated genotypes. Larval nerves were stimulated at a frequency of 1 Hz, and 10 responses were measured from each of nine larvae (for D42>PI3K-CAAX and D42>PI3KDN) and for six larvae from other genotypes. Means+/−SEMs are shown. One-way ANOVA and Fisher's LSD gave the following differences, at 0.1 mM, 0.15 mM and 0.2 mM [Ca2+], respectively: For D42>+: vs. D42>PI3K-CAAX, p = 0.028, 0.05, 0.04; vs. D42>PTEN, p = 0.017, 0.03, 0.06; vs. D42>PI3KDN, p = 0.0018, 0.0033, 0.14; vs. mGluR112b, p = 0.0077, 0.0029, 0.01. For mGluR112b, D42>PI3K-CAAX vs: mGluR112b, p<0.0001, <0.0001, 0.0001; vs. D42>PI3K-CAAX, p = 0.70, 0.47, 0.26. D) Effects of altered PI3K pathway activity on failures of transmitter release. Mean transmitter release success rate +/−SEMs (Y axis) at the indicated Ca2+ concentration (X axis) for the indicated genotypes. Larval nerves were stimulated at 1 Hz. 10 responses were collected per nerve from each of 6 larvae for the given genotype and at the given Ca2+ concentration. One-way ANOVA and Fisher's LSD gave the following differences, at 0.1 mM, 0.15 mM and 0.2 mM [Ca2+], respectively: For D42>+: vs. D42>PI3K-CAAX, p = 0.0023, 0.023, 0.001; vs. D42>PTEN, p = 0.0014, 0.0068, 0.69; vs. D42>PI3KDN, p = 0.011, 0.003, 0.63; vs. mGluR112b, p = 0.027, 0.0053, 0.99. For mGluR112b, D42>PI3K-CAAX vs: mGluR112b, p = 0.0001, <0.0001, 0.94; vs. D42>PI3K-CAAX, p = 0.21, 0.45, 0.0008.
Figure 2
Figure 2. Glutamate application stimulates presynaptic Akt phosphorylation in DmGluRA+ but not in DmGluRA112b mutant larvae.
A) Representative confocal images of DmGluRA+, DmGluRA112b, D42>DmGluRARNAi and D42>PI3KDN larvae stained with anti-HRP (upper) and anti-p-Akt (lower) in the indicated conditions. All images are from muscles 7 and 6 of abdominal segment A3 or A4. Scale bar = 20 µm. B) Quantification of phosphorylated Akt (p-Akt) levels in DmGluRA+, DmGluRA112b, D42>DmGluRARNAi and D42>PI3KDN larvae immediately prior to glutamate application, after 1 min of 100 µM glutamate application (final bath concentration), and 10 min after a wash with glutamate free media. Nerve terminals were outlined with HRP fluorescence as reference. Pixel intensities were quantified using ImageJ software and background subtraction was performed as described in detail in Methods section. Bars represent mean synaptic p-Akt levels +/−SEMs. D42>PI3K-CAAX is included as a positive control. One-way ANOVA and Fisher's LSD gave the following significant differences for p-Akt levels one minute after glutamate application. For DmGluRA+ vs. DmGluRA112b, p = 0.0072; vs. D42>PI3KDN, p = 0.0097; vs. D42>DmGluRARNAi, p<0.0001.
Figure 3
Figure 3. Foxo mediates the effects of PI3K on motor neuron excitability.
The Gal4 driver D42 was used to drive expression of transgenes in all genotypes except for Foxo21/Foxo25; OK6>PI3KDN, in which the motor neuron driver OK6 was used and which behaves similarly to D42 in this assay. For all LTF experiments, the bath solution contained 0.15 mM [Ca2+] and 100 µM quinidine. A) Representative traces showing the decreased rate of onset of LTF (I) and decreased ejp amplitude (II) in Foxo21/Foxo25 larvae compared to wildtype at the indicated [Ca2+], and the increased rate of onset of LTF and ejp amplitude in larvae overexpressing Foxo. Arrowheads indicate the increased and asynchronous ejps, indicative of onset of LTF. In (II), representative traces are averages of multiple ejps. From top to bottom, n = 23, 180, and 34 respectively. B) Number of stimulations required to induce LTF (Y axis) at the indicated stimulus frequencies (X axis). Geometric means+/−SEMs are shown. From top to bottom, n = 12, 6, 7, 18, 10, 21, 5, and 9 respectively, for each genotype. One-way ANOVA and Fisher's LSD gave the following differences, at 10 Hz, 7 Hz, 5 Hz and 3 Hz, respectively: For D42>+ vs. Foxo21/Foxo25, p = 0.0096, 0.0069, <0.0001, 0.0007; vs. D42>Foxo+, p = 0.0026, 0.0012, <0.0001, 0.0065. For D42>PI3K-CAAX, Foxo vs. D42>PI3K-CAAX, p = 0.0041, 0.0005, 0.0002, 0.0006; vs. D42>Foxo, p = 0.50, 0.43, 0.16, 0.14. For Foxo21Foxo25; OK6>PI3KDN vs. OK6>PI3KDN, p = ; 0.0003, 0.0004, 0.0014, 0.001. vs. Foxo21Foxo25, p = 0.63, 0.74, 0.43, 0.20. C) Mean ejp amplitude +/−SEMs (Y axis) for each genotype at the indicated [Ca2+]. Nerves from six larvae were stimulated at a frequency of 1 Hz, and 10 responses were measured per larva. One-way ANOVA and Fisher's LSD gave the following differences, at 0.1 mM, 0.15 mM and 0.2 mM [Ca2+], respectively: For D42>+ vs. Foxo21/Foxo25, p = 0.0079, <0.0001, 0.012; vs. D42>Foxo, p = 0.017, 0.0005, 0.10. For Foxo21/Foxo25; OK6>PI3KDN: vs. Foxo21/Foxo25, p = 0.74, 0.12, 0.93; vs. D42>PI3KDN, p<0.0001, <0.0001, 0.0001; vs. D42>PTEN, p<0.0001, <0.0001, <0.0001. For D42>PI3K-CAAX, Foxo vs. D42>PI3K-CAAX, p<0.0001, <0.0001,  = 0.0024; vs. D42>Foxo, p = 0.52, 0.13, 0.77. D) Mean transmitter release success rate +/−SEMs (Y axis) at the indicated Ca2+ concentration (X axis) for the indicated genotypes. Larval nerves were stimulated at 1 Hz. 10 responses were collected per nerve from each of 6 larvae for the given genotype and at the given Ca2+ concentration. One-way ANOVA and Fisher's LSD gave the following differences, at 0.1 mM, 0.15 mM and 0.2 mM [Ca2+], respectively: For D42>+ vs. Foxo21/Foxo25, p = 0.0008, 0.0039, 0.0009; vs. D42>Foxo, p = 0.0008, 0.004, 0.7. For Foxo21/Foxo25; OK6>PI3KDN: vs. Foxo21/Foxo25, p = 0.81, 0.99, 0.43. vs. D42>PI3KDN, p<0.0001, <0.0001, <0.0001. vs. D42>PTEN, p<0.0001, <0.0001. <0.0001. For D42>PI3K-CAAX, Foxo vs. D42>PI3K-CAAX, p<0.0001, <0.0001,  = 0.002; vs. D42>Foxo, p = 0.29, 0.98, 0.7.
Figure 4
Figure 4. S6K does not mediate the effects of PI3K on motor neuron excitability.
Number of stimulations required to induce LTF (Y axis) at the indicated stimulus frequencies (X axis). The bath solution contained 0.15 mM [Ca2+] and 0.1 mM quinidine. Geometric means+/−SEMs are shown. From top to bottom, n = 12, 7, 9, 14, and 18 respectively, for each genotype.
Figure 5
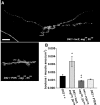
Figure 5. PI3K regulates synapse formation and axon growth via S6K, not Foxo.
A) Representative images of muscles 7 and 6 in the indicated genotypes. Larva were stained with anti-HRP (green). Scale bar = 50 µm. B) Mean number (+/−S.E.M.s) of synaptic boutons normalized to the surface area of muscle 6 at abdominal segment A3 in the indicated genotypes. From left to right, n = 6, 8, 6, 6, 7, 11, 11, respectively, for each genotype. One-way ANOVA and Fisher's LSD gave the following differences: For D42>S6KAct vs. D42>PI3K-CAAX, p = 0.40; vs. D42>+, p = 0.0009. For D42>PI3K-CAAX vs. D42>PI3K-CAAX, Foxo, p = 0.64; vs. D42>PI3K-CAAX, S6KDN, p = 0.05. C) Representative transmission electron micrographs of peripheral nerve cross sections. Axons are marked with arrows. Scale bar = 2 µm. D) Mean axon diameter (+/−S.E.M.s) of the five largest axons from five different nerves (25 measurements total) for the indicated genotypes. One-way ANOVA and Fisher's LSD gave the following significant differences: for D42>+: vs. D42>PI3K-CAAX, p<0.0001; vs, D42>PTEN, p<0.0001; vs. D42>S6KDN, p = 0.0009; vs. D42>S6Kact, p<0.0001; vs. D42>PI3K-CAAX, Foxo, p<0.0001; vs D42>PI3K-CAAX, S6KDN, p = 0.0011. For D42>PI3K-CAAX vs. D42>PI3K-CAAX, S6KDN, p = 0.0002. Means from D42>PI3K-CAAX and D42>PI3K-CAAX, Foxo were judged to be not significantly different (p = 0.43).
Figure 6
Figure 6. PI3KDN expression suppresses the synaptic overgrowth conferred by motor neuron expression of eagDN and ShDN.
The D42 Gal4 driver was used to induce motor neuron transgene expression. A) Representative confocal images of muscles 7 and 6 in the indicated genotypes. Larvae were stained with anti-HRP (green). Scale bar = 20 µm. B) Mean number (+/−S.E.M.s) of synaptic boutons normalized to the surface area (Y axis) of muscle 6 at abdominal segment A3 in the indicated genotypes (X axis). From top to bottom, n = 12, 6, 6 and 6 respectively, for each genotype. One-way ANOVA and Fisher's LSD gave the following differences: For D42>lacZ, eagDN, ShDN vs. D42>+, p = 0.027; vs. D42>PI3KDN, eagDN, ShDN, p = 0.0075. For D42>PI3KDN, eagDN, ShDN vs. D42>PTEN, p = 0.86.
Figure 7
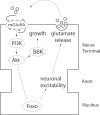
Figure 7. A model for the negative feedback loop regulating motor neuron excitability.
The transcription factor Foxo increases neuronal excitability through a mechanism possibly involving transcription of ion channel subunits or regulators. This increased excitability promotes glutamate release from motor nerve terminals, which then activates presynaptic DmGluRA in an autocrine manner. This activation, in turn, activates PI3K and the subsequent inactivation of Foxo by Akt-mediated inhibitory phosphorylation. Activated PI3K also promotes axonal growth and synapse formation via the Tor/S6K pathway.

References

    1. Davis GW. Homeostatic Control of Neural Activity: From Phenomenology to Molecular Design. Annu Rev Neurosci 2006 - PubMed
    1. Marder E, Prinz AA. Current compensation in neuronal homeostasis. Neuron. 2003;37:2–4. - PubMed
    1. Pozzi D, Condliffe S, Bozzi Y, Chikhladze M, Grumelli C, et al. Activity-dependent phosphorylation of Ser187 is required for SNAP-25-negative modulation of neuronal voltage-gated calcium channels. Proc Natl Acad Sci U S A. 2008;105:323–328. - PMC - PubMed
    1. Desai NS, Rutherford LC, Turrigiano GG. Plasticity in the intrinsic excitability of cortical pyramidal neurons. Nat Neurosci. 1999;2:515–520. - PubMed
    1. Echegoyen J, Neu A, Graber KD, Soltesz I. Homeostatic plasticity studied using in vivo hippocampal activity-blockade: synaptic scaling, intrinsic plasticity and age-dependence. PLoS ONE. 2007;2:e700. - PMC - PubMed

Publication types

MeSH terms

Substances

LinkOut - more resources