Comparative Study
. 2008 Nov;4(11):e1000283.
doi: 10.1371/journal.pgen.1000283. Epub 2008 Nov 28.

Profiling synaptic proteins identifies regulators of insulin secretion and lifespan

Affiliations
Comparative Study

Profiling synaptic proteins identifies regulators of insulin secretion and lifespan

Queelim Ch'ng et al. PLoS Genet. 2008 Nov.

Abstract

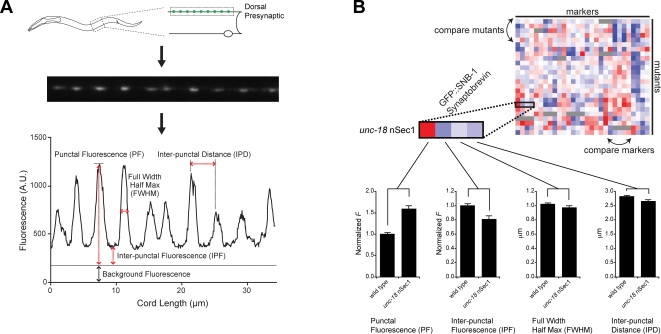
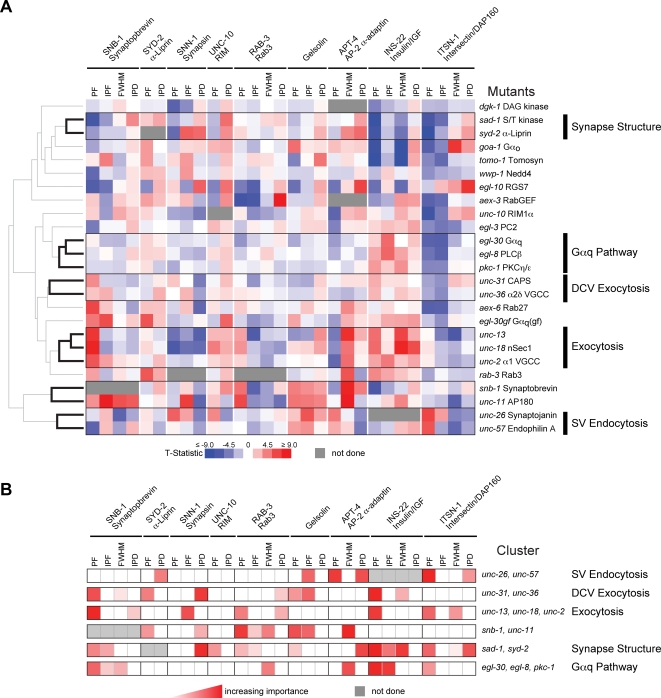
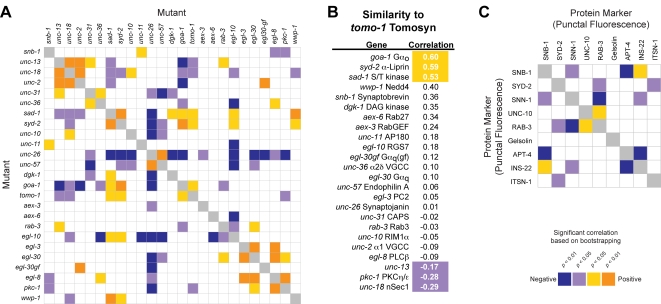
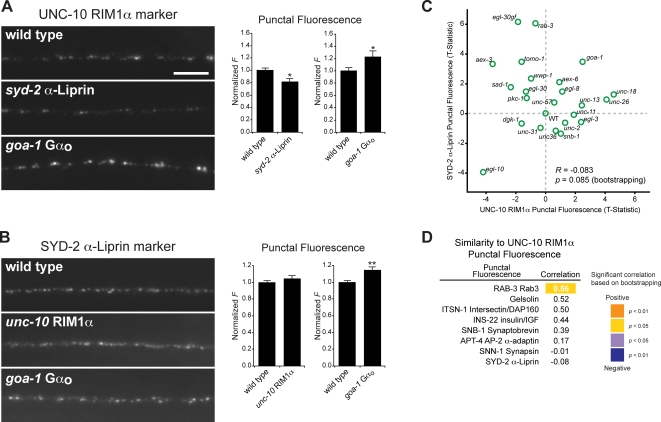
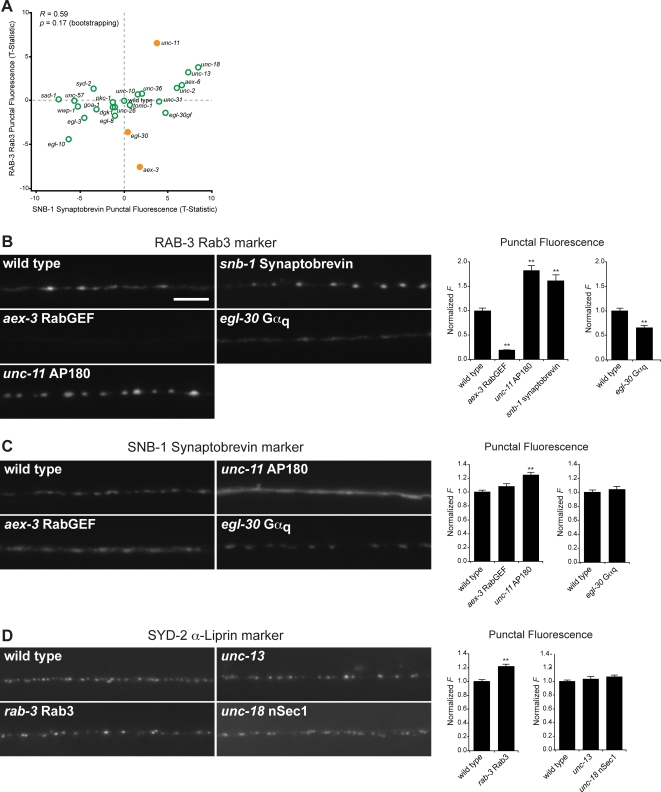
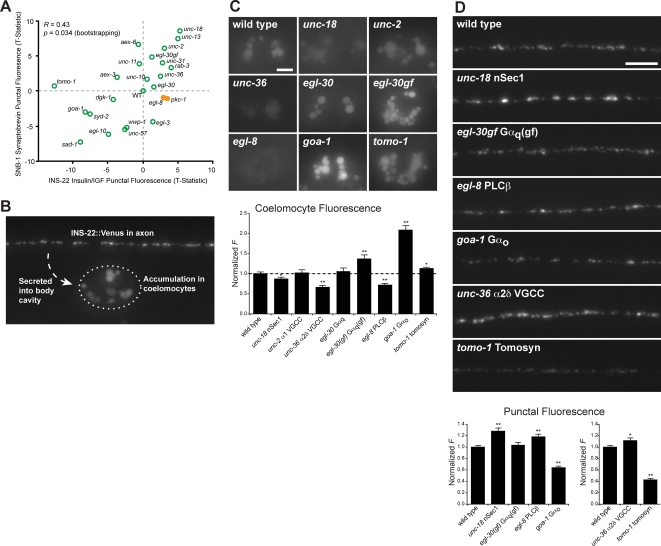
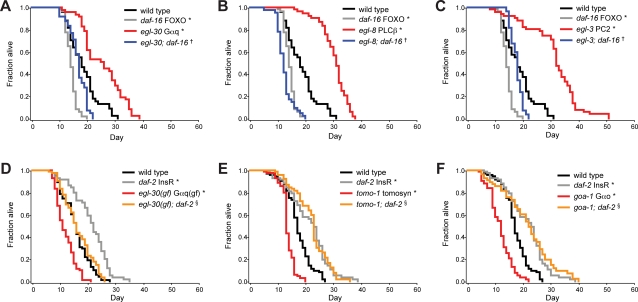
Cells are organized into distinct compartments to perform specific tasks with spatial precision. In neurons, presynaptic specializations are biochemically complex subcellular structures dedicated to neurotransmitter secretion. Activity-dependent changes in the abundance of presynaptic proteins are thought to endow synapses with different functional states; however, relatively little is known about the rules that govern changes in the composition of presynaptic terminals. We describe a genetic strategy to systematically analyze protein localization at Caenorhabditis elegans presynaptic specializations. Nine presynaptic proteins were GFP-tagged, allowing visualization of multiple presynaptic structures. Changes in the distribution and abundance of these proteins were quantified in 25 mutants that alter different aspects of neurotransmission. Global analysis of these data identified novel relationships between particular presynaptic components and provides a new method to compare gene functions by identifying shared protein localization phenotypes. Using this strategy, we identified several genes that regulate secretion of insulin-like growth factors (IGFs) and influence lifespan in a manner dependent on insulin/IGF signaling.


Conflict of interest statement

The authors have declared that no competing interests exist.

Figures

Figure 1
Figure 1. In vivo imaging of synaptic proteins.
(A) Top: Imaging presynaptic specializations in dorsal axons at the NMJ. Middle: Fluorescence image of SNB-1 synaptobrevin in wild type animals. Each punctum represents a cluster of SV at a presynaptic terminal. Bottom: A trace representing pixel fluorescence values along the axon. Parameters analyzed in this study are indicated. (B) Representation of changes observed in the four parameters for each synaptic marker in each mutant background tested. Changes in each parameter are expressed as a continuous score reflecting the magnitude and significance of the change between mutant and the corresponding wild type control samples based on the Student's T-statistic. Positive scores (red shading) and negative scores (blue shading) indicate an increase or decrease respectively in a given parameter in the mutant compared to wild type. The magnitude of the score is indicated by the intensity of the shading. How unc-18 nSec1 mutants affected SNB-1 synaptobrevin is used as an example. Error bars are ±SEM.
Figure 2
Figure 2. Clustering analysis of synaptic proteins and synaptic transmission mutants.
(A) Phenotypic clustering of mutants. Each row represents the protein localization profile of a single mutant corresponding to the indicated gene. Increases and decreases in the parameters measured (see text and Figure 1B) are represented in red and blue respectively, and the magnitudes of the changes are indicated by the intensity. Black branches in the dendrogram and boxed areas indicate robust and statistically significant clusters (p<0.05 with Bonferroni Correction). The function of the genes in a cluster is indicated to the right. PF = punctal fluorescence, IPF = Inter-punctal fluorescence, FWHM = Full Width at Half Maximal, IPD = Inter-punctal Distance. IPF was not analyzed in some protein markers (e.g. SYD-2 α-Liprin) because it was not significantly above background. FWHM was not analyzed for markers where the puncta were diffraction limited (e.g. UNC-10 RIM1α). (B) Shared phenotypes for each cluster. Each row represents the analysis of a single cluster. The contribution of each parameter to the grouping of each cluster, as calculated by the amount their exclusion reduced the strength of correlations between phenotypic profiles within each cluster is indicated in red. (See Materials and Methods and Supporting Information in Text S1.) Darker shading indicates increasing importance of the parameter for the grouping of the cluster. The genes in each cluster and their function are indicated to the right.
Figure 3
Figure 3. Correlation analysis among mutants and markers.
(A) Correlations between the phenotypic profiles of mutants analyzed. Pairwise Pearson's Correlation Coefficients were calculated between all mutations tested, with significant positive or negative correlations indicated by shaded boxes according to the legend in (C). (B) Genes ranked by similarity to an example query gene, tomo-1 tomosyn, based on their correlation values to tomo-1 tomosyn; higher positive correlation indicates greater similarity. Significant positive and negative correlations based on bootstrapping (Material and Methods) are shaded according to the legend in (C). (C) Correlations between the marker profiles of presynaptic markers. Significant correlations are shaded as indicated in the legend. For comparing markers, we analyzed the punctal fluorescence as a measure of presynaptic abundance in each mutant background and compared all pairwise combinations.
Figure 4
Figure 4. Analysis of active zones.
(A) Images of UNC-10 RIM1α in axons of wild type and the indicated mutant animals. Scale bar, 5 µm. Quantification of UNC-10 RIM1α punctal fluorescence is shown to the right. (B) Images of SYD-2 α-Liprin in axons of wild type and the indicated mutant animals. Quantification of SYD-2 α-Liprin punctal fluorescence is shown to the right. In (A–B), * indicates p<0.05, ** indicates p<0.01, (Student's T-Test compared to wild type). All error bars are ±SEM. Separate charts indicate data from separate sets of experiments. (C) XY plot revealing lack of correlation between changes in the punctal fluorescence of SYD-2 α-Liprin and UNC-10 RIM1α. (D) List of markers ranked by similarity to UNC-10 RIM1α based on their punctal fluorescence.
Figure 5
Figure 5. Analysis of SV and active zone markers.
(A) XY plot comparing changes in punctal fluorescence for SV markers: RAB-3 vs. SNB-1 synaptobrevin across mutants tested. Solid orange circles indicate mutants that are apparent outliers described in the text. (B) Images of RAB-3 in axons of wild type and the indicated mutant animals. Quantification of RAB-3 punctal fluorescence is shown to the right. Scale bar, 5 µm. (C) Images of the SNB-1 synaptobrevin in axons of wild type and the indicated mutant animals. Quantification of SNB-1 synaptobrevin punctal fluorescence is shown to the right. (D) Images of SYD-2 α-Liprin in axons of wild type and the indicated mutant animals. Quantification of SYD-2 α-Liprin punctal fluorescence is shown to the right. In (B–D), ** indicates p<0.01, (Student's T-Test compared to wild type). All error bars are ±SEM. Separate charts indicate data from separate sets of experiments.
Figure 6
Figure 6. Analysis of DCV accumulation in axons and insulin/IGF secretion.
(A) XY plot comparing changes in the punctal fluorescence of SNB-1 synaptobrevin and INS-22 insulin/IGF. Two mutants with more prominent increases in INS-22 insulin/IGF than SNB-1 synaptobrevin are shown as solid orange circles. (B) Secreted INS-22 insulin/IGF expressed in motorneurons accumulates in coelomocytes. (C) Images of INS-22 insulin/IGF accumulation in coelomocytes in wild type and mutant animals. Scale bar, 5 µm. Below is shown the quantification of coelomocyte INS-22 insulin/IGF fluorescence. (D) Images of axonal INS-22 insulin/IGF in wild type animals and mutants with altered INS-22 insulin/IGF coelomocyte fluorescence. Scale bar, 5 µm. Below is shown the quantification of INS-22 insulin/IGF punctal fluorescence. In (C–D), * indicates p<0.05, ** indicates p<0.01, (Student's T-Test compared to wild type). All error bars are ±SEM. Separate charts indicate data from separate sets of experiments.
Figure 7
Figure 7. Insulin/IGF secretion mutants show lifespan phenotypes.
(A–F) Survival curves with indicated genotypes. * indicates significantly different lifespan from wild type (p<0.0001), † indicates significant suppression by daf-16 FOXO (p<0.0001), § indicates significant suppression by daf-2 InsR (p<0.0001), (Log Rank Test).

References

    1. Huh WK, Falvo JV, Gerke LC, Carroll AS, Howson RW, et al. Global analysis of protein localization in budding yeast. Nature. 2003;425:686–691. - PubMed
    1. Eisen MB, Spellman PT, Brown PO, Botstein D. Cluster analysis and display of genome-wide expression patterns. Proc Natl Acad Sci U S A. 1998;95:14863–14868. - PMC - PubMed
    1. Piano F, Schetter AJ, Morton DG, Gunsalus KC, Reinke V, et al. Gene clustering based on RNAi phenotypes of ovary-enriched genes in C. elegans. Curr Biol. 2002;12:1959–1964. - PubMed
    1. Schuldiner M, Collins SR, Thompson NJ, Denic V, Bhamidipati A, et al. Exploration of the function and organization of the yeast early secretory pathway through an epistatic miniarray profile. Cell. 2005;123:507–519. - PubMed
    1. Sudhof TC. The synaptic vesicle cycle. Annu Rev Neurosci. 2004;27:509–547. - PubMed

Publication types

MeSH terms