. 2008 Nov;4(11):e1000287.
doi: 10.1371/journal.pgen.1000287. Epub 2008 Nov 28.

Genetic analysis of human traits in vitro: drug response and gene expression in lymphoblastoid cell lines

Affiliations

Genetic analysis of human traits in vitro: drug response and gene expression in lymphoblastoid cell lines

Edwin Choy et al. PLoS Genet. 2008 Nov.

Abstract

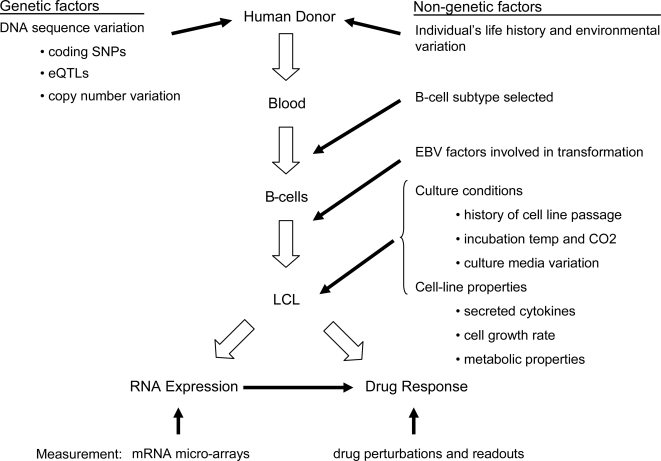
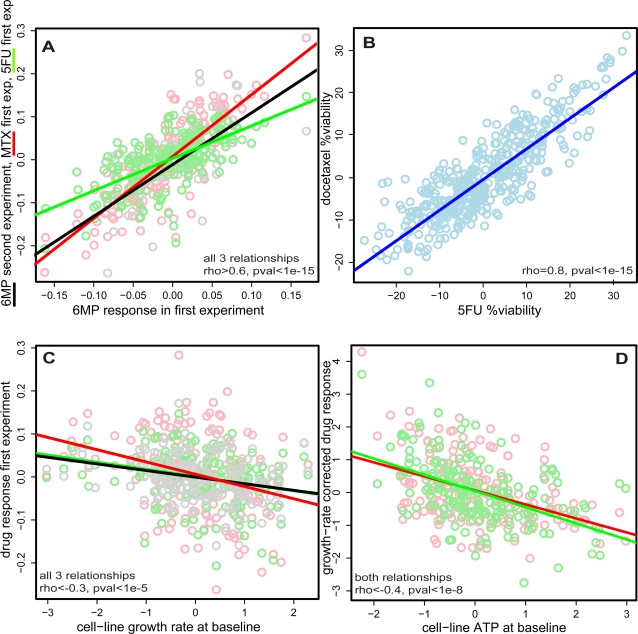
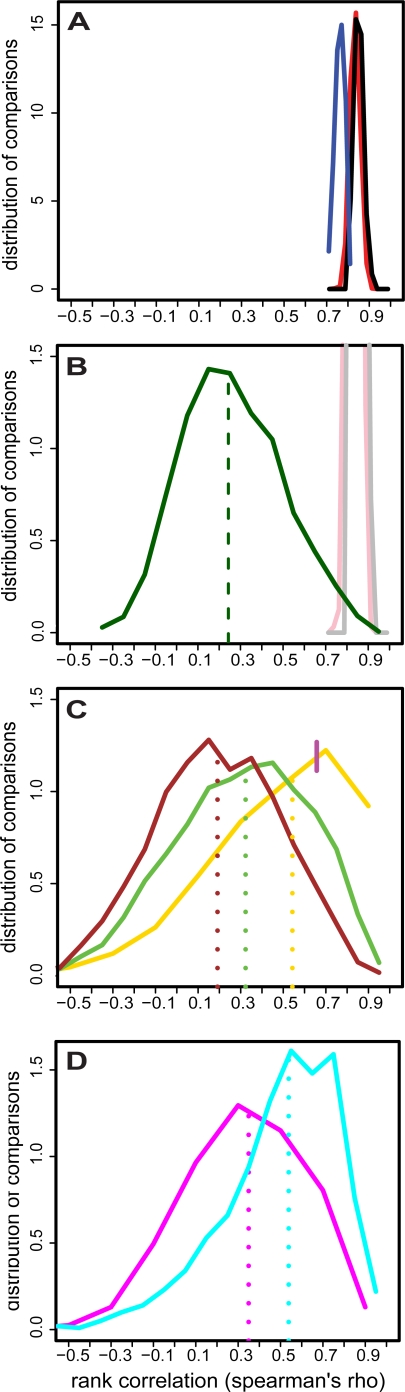
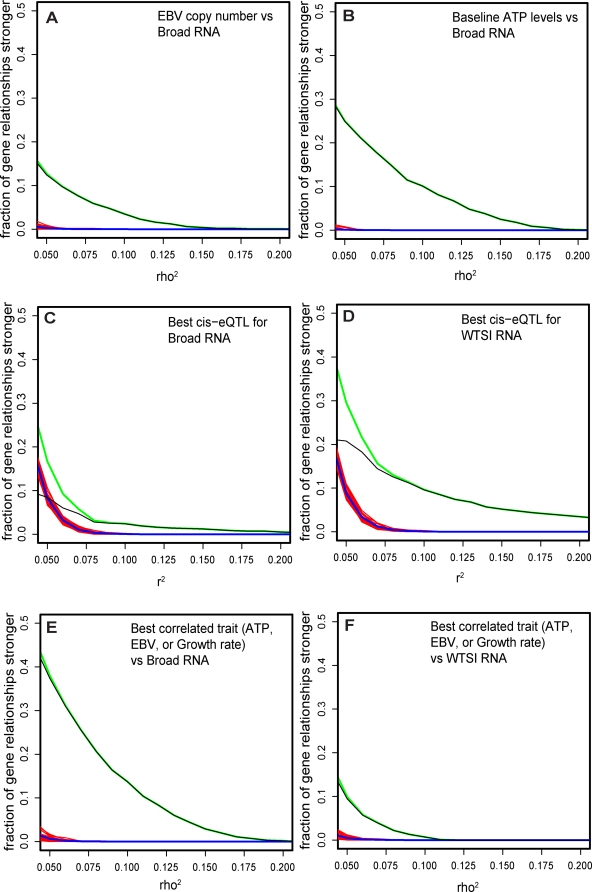
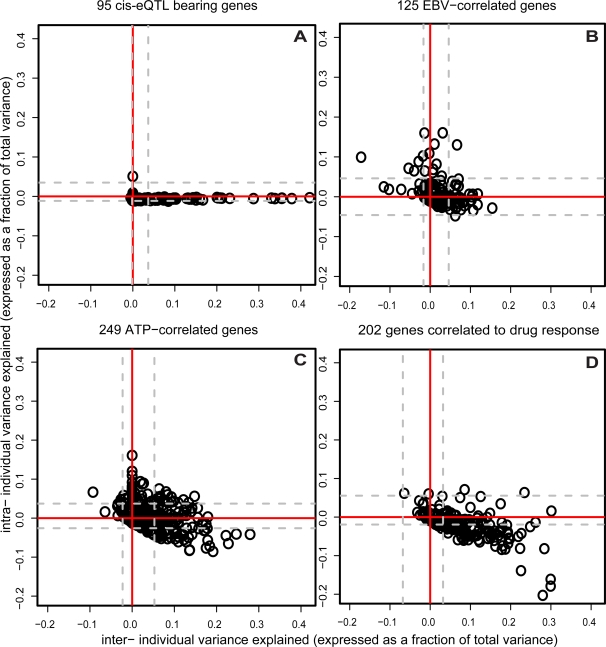
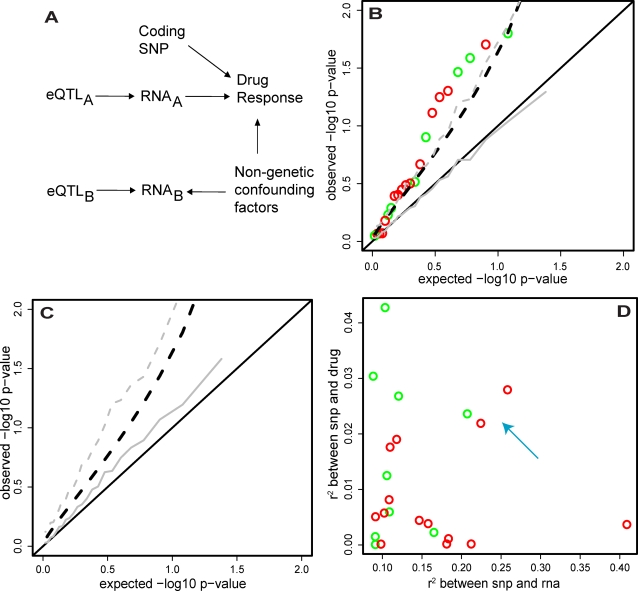
Lymphoblastoid cell lines (LCLs), originally collected as renewable sources of DNA, are now being used as a model system to study genotype-phenotype relationships in human cells, including searches for QTLs influencing levels of individual mRNAs and responses to drugs and radiation. In the course of attempting to map genes for drug response using 269 LCLs from the International HapMap Project, we evaluated the extent to which biological noise and non-genetic confounders contribute to trait variability in LCLs. While drug responses could be technically well measured on a given day, we observed significant day-to-day variability and substantial correlation to non-genetic confounders, such as baseline growth rates and metabolic state in culture. After correcting for these confounders, we were unable to detect any QTLs with genome-wide significance for drug response. A much higher proportion of variance in mRNA levels may be attributed to non-genetic factors (intra-individual variance--i.e., biological noise, levels of the EBV virus used to transform the cells, ATP levels) than to detectable eQTLs. Finally, in an attempt to improve power, we focused analysis on those genes that had both detectable eQTLs and correlation to drug response; we were unable to detect evidence that eQTL SNPs are convincingly associated with drug response in the model. While LCLs are a promising model for pharmacogenetic experiments, biological noise and in vitro artifacts may reduce power and have the potential to create spurious association due to confounding.


Conflict of interest statement

The authors have declared that no competing interests exist.

Figures

Figure 1
Figure 1. Genetic and non-genetic factors influencing lymphoblastoid cell lines as a model system to understand human physiology.
Figure 2
Figure 2. Drug response is correlated across multiple drugs, to growth rate and to baseline ATP levels of the cell line.
(A) Relative drug responses were calculated for each individual as described in Methods to obtain a single number summary of the cell line response to each drug on each day. The black circles represent an individual cell line's relative response to 6MP assayed on day one plotted against 6MP relative response assayed on day two. The red circles similarly represent relative response to 6MP plotted against relative response to MTX, both assayed on day one. The green circles represent relative response to 6MP plotted against relative response to 5FU, again both assayed on day one. Lines represent regressions for each of the three comparisons and show that not only is relative drug response a reproducible trait, but also can be correlated across multiple drugs. (B) Using online data made publicly available by Watters et al. , relative drug response to docetaxel and 5FU was calculated using the 427 individuals with no missing data to obtain a single number for each drug, in each individual, as in (A). Response to docetaxel was plotted against 5FU for each individual. The line represents the regression for the comparison and indicates that the effect observed in (A) is neither limited to our experiments, nor to the particular drugs we attempted. (C) The baseline growth-rate of each individual's cell line was estimated as described in the Methods. This growth rate is plotted against relative response for 6MP (black), MTX (red), and 5FU (green). Lines represent regressions for the respective comparisons and all correspond to significant correlations. (D) For each individual, baseline ATP levels were measured using Celltiter glo in the mock-treated wells in drug response assays. EC50 response was calculated correcting for growth rate (see Methods). Relative ATP levels were plotted against the growth-rate corrected EC50 for MTX (red), and 5FU (green). Lines represent regression for the comparisons and indicate significant correlations.
Figure 3
Figure 3. Biological variation in RNA expression.
49 unrelated individuals were whole-genome RNA profiled on the Affymetrix platform in two independent experiments at the Broad Institute. (same-platform biological replicates) A subset of 14 (of the 49) were also profiled independently at the WTSI on the Illumina platform (cross-platform biological replicates) and an aliquot of that RNA (“WTSI RNA”) was again profiled at the Broad Institute on the Affymetrix platform. (cross-platform technical replicates) (A) Expression values of all 3538 expressed genes were ranked in each of the 14 unrelated individuals in the two Broad Institute biological replicate experiments and ranks were compared between: the same individuals in two separate experiments (black); all pairs of unrelated individuals across two experiments (red); 5 chimpanzees assayed in the first experiment and all individuals assayed in the second experiment (blue). Plot shows that overall expression profiles in LCLs are highly similar across biological replicates, between unrelated individuals, and even across species. (B) The 49 individuals were ranked according to their relative levels of each gene in the first Broad experiment. The ranking was then independently repeated for the second Broad experiment. Ranks were compared across the two experiments for each gene and the results plotted in (green), with the median of the distribution in (dotted green). Plot shows that when any given gene is examined, there is substantial variation in the relative order of individuals between two independent experiments, despite the relative order of genes being highly stable as shown in (A). Light black and red lines are same as (A) for comparison. (C) On the set of 14 individuals, per-gene rank comparisons as in (B) are computed for: WTSI RNA assayed on the Illumina platform vs. WTSI RNA assayed on the Affymetrix platform (gold solid and dotted); WTSI RNA assayed on the Illumina platform vs. RNA extracted at the Broad Institute during the first experiment and assayed on the Affymetrix platform (brown solid and dotted); the two independent Broad experiments as in (B), (green solid and dotted). Plot shows substantial biological variation in the relative levels of any given gene when profiling experiments are repeated, far in excess of that might be expected from measurement error alone. Magenta dash indicates the cut-off for the 1000 “technically best-measured” genes to use in (D). (D) The analysis for the brown and green curve in (C) is repeated only for the 1000 “best-measured” genes and plotted in magenta and cyan respectively. Plot shows that even if measurement noise is limited, a substantial portion of the variance in gene expression represents biological noise.
Figure 4
Figure 4. RNA expression is correlated to SNPs and cellular traits.
198 unrelated individuals were whole-genome RNA profiled on the Affymetrix platform at the Broad Institute (“Broad RNA”) and independently on the Illumina platform at WTSI (“WTSI RNA”). The 1000 “best-measured” genes identified in Figure 3 were tested for correlation to SNPs and cellular traits. (A) For each tested gene, Broad RNA expression levels were rank-correlated to copy numbers of EBV, as determined by quantitative PCR. The correlation was expressed as rho2 and curves representing distributions of the rho2values are plotted. The green curve is the observed distribution of EBV-RNA correlations. The red curves represent 20 permuted distributions. The blue curve is the average of permuted distributions. The black curve is the difference between observed and permuted values and thus a lower bound (see Methods) of the fraction of genes correlated to EBV at a given rho2. Plot shows that ∼15% of expressed genes have >5% of their (rank) variance in expression explained by EBV levels. (B) For each tested gene, Broad RNA expression levels were correlated to baseline ATP levels determined by measuring Celltiter glo in mock-treated wells in the drug response assays. Curves representing the distribution of rho2 values were plotted for the tested genes as in (A). Plot shows that >25% of expressed genes have >5% of their variance in expression explained by ATP levels. (C) For each tested gene, Broad RNA expression levels were correlated to all SNPs with MAF>10% within a 0.15 Mb window around the gene, using the HapMap phase II data. Curves representing the distribution of the largest r2 value was plotted for each tested genes as in (A). Plot shows that >9% of genes have >5% of their variance in expression explained by SNPs in the Broad RNA dataset. (D) For each tested gene, Sanger RNA expression levels were correlated to all SNPs with MAF>10% within a 0.15 Mb window around the gene, using the HapMap phase II data. Curves representing the distribution of the strongest r2 value was plotted for each tested genes as in (C). Plot shows that >20% of genes have >5% of their variance in expression explained by SNPs in the WTSI RNA dataset. (E) For each tested gene, Broad RNA expression levels were correlated to EBV, growth rate, and relative ATP, and the strongest observed correlation among the 3 phenotypes was plotted. Strikingly, plot shows that >40% of genes have >5% of their variance in expression explained by one of these covariates. (F) For each tested gene, WTSI RNA expression levels were correlated to EBV, growth rate, and relative ATP, and the strongest observed correlation among the 3 phenotypes was plotted. Strikingly, plot shows that the effect of covariates in (E) is observable even when looking at a completely separate expression experiment, performed independently of covariate collection.
Figure 5
Figure 5. Correlation of eQTLs, EBV, and ATP to inter- and intra-individual variation in RNA expression levels, and correlation of RNA expression levels to inter- and intra-individual variation in drug response.
Total variance for each of the 1000 “best-measured” genes was separated into inter- and intra- individual variance components (see Methods) using expression data from the 49 unrelated individuals measured twice at the Broad Institute on the Affymetrix platform. (A) 95 genes with eQTLs that explained >10% of expression variance (FDR<10%) in the WTSI dataset were selected (to maximize eQTL detection power) and the SNP genotype was included in the variance components model of the gene to “account” for its effect. −1 times the change in each variance component is plotted for each gene. As expected, the plot shows that that SNPs (which remain fixed across experiments) only explain inter-individual variation in expression. Grey dashed lines indicate the inter- and intra- 2.5% and 97.5%-tiles of the distribution of variance component change estimates when the entire analysis is repeated on a permuted dataset. (B) 125 genes correlated to EBV at rho2>.05 (FDR<10%) were selected and the EBV measurement was included in the variance components model of the gene to “account” for its effect. −1 times the change in each variance component is plotted for each gene. The plot shows that EBV is correlated to inter-individual differences in gene expression that persist across experiments, intra-individual fluctuation in gene expression between experiments, or both, depending on the gene in question. Grey dashed lines are as in (A). (C) 249 genes correlated to ATP at rho2>.05 (FDR<10%) were selected and the ATP measurement was included in the variance components model of the gene to “account” for its effect. −1 times the change in each variance component is plotted for each gene. The plot shows that ATP is correlated to inter-individual differences in gene expression that persist across experiments, intra-individual fluctuation in gene expression between experiments, or both, depending on the gene in question. Grey dashed lines are as in (A). (D) 202 “drug-response correlated” genes were defined as in Figure 6. The expression of each gene was incorporated in a variance components model of the assigned drug response EC50 to examine the correlation of the gene to its strongest correlated drug. −1 times the change in the variance components of drug response is plotted for each gene, showing that it is mostly the inter- individual differences in gene expression that are correlated to cell line drug response. Grey dashed lines are as in (A).
Figure 6
Figure 6. Effect of cis-eQTLs in drug-response correlated genes on drug-response.
The 198 unrelated individuals were ranked by RNA expression value for each of the 1000 “best-measured” genes. These individuals were then ranked by response (growth/ATP- corrected EC50) to each of the 5 assayed drugs. Rank-correlations (spearman's rho) were computed for each gene-X-drug pair (1000×5) and the drug with the strongest correlation to a given gene was “assigned” to that gene. The 202 genes whose strongest drug correlations exceeded rho2 = .05 (FDR<10%) were taken as “drug-response correlated” genes. If such a gene also had a cis-eQTL that explained at least 8% (FDR<10%) of its variance, the SNP-RNA-Drug relationship was considered in the foregoing panels. We considered 23 SNP-RNA-Drug response relationships (14 derived using WTSI RNA dataset+9 derived using the Broad Institute RNA dataset). (A) Diagram of different relationships between SNPs, RNA levels, and drug response. Coding SNPs have direct (non-RNA mediated) effects on drug response by altering protein function. No SNPs of this class were found at genome-wide significance in our GWAS scan. Changes in RNAA influences drug response. An eQTL for one of these RNAs (i.e. eQTLA) is thereby associated with drug response.Non-genetic confounding factors simultaneously influence RNAB levels and drug response; changes in RNAB do not influence drug response (this is the expected scenario for most RNAs). Even if levels of these RNAs are associated with eQTLs, these eQTLs are not associated with drug response. (B) For each SNP-RNA-Drug response relationship (WTSI – red, Broad – green) the drug response was regressed against the eQTL SNP genotype. P-values are plotted as open circles against their expectation under the null distribution. Black solid line indicates the theoretical flat uniform distribution expected under the null and black dashed line is the p = .05 one-sided significance threshold for deviation from the null. Grey lines show equivalent null parameters, but derived from a simulated dataset with the same SNP/RNA/Drug variances and independent SNP-RNA/RNA-Drug pairwise covariances as the real 23 SNP-RNA-Drug response relationships. Plot shows that the observed p-value distribution for drug-response regressed against RNA eQTL SNPs exceeds that expected by chance. (C) For each SNP-RNA-Drug response relationship, simulated datasets were created with the same SNP/RNA/Drug variances and RNA-Drug pairwise covariance as the real 23 SNP-RNA-Drug response relationships, but with the real SNP-RNA covariances replaced by r2 = 0.05. Then, only those simulations where the observed SNP-RNA association exceeded r2 = 0.08 were used to plot the median and p = .05 SNP-Drug p-value distributions as in (B) (again, grey solid and grey dashed lines, respectively). Black lines also as in (B). Plot shows that “winner's curse” in eQTL discovery leads to an inflation of SNP-Drug associations, in the absence of any RNA influence on Drug response. (D) For each SNP-RNA-Drug response relationship (WTSI – red, Broad – green), the correlation between SNP and RNA is plotted against the correlation between SNP and Drug. Most increased association between SNP and Drug response comes from the weaker eQTLs, while most of the stronger eQTLs have no association with drug response, consistent with the winner's curse phenomenon displayed in (C). Additionally, 3 SNP-RNA-Drug response relationships emerge that are both relatively strong SNP-RNA and SNP-Drug response associations, indicated by the light blue arrow.

References

    1. McCarthy MI, Abecasis GR, Cardon LR, Goldstein DB, Little J, et al. Genome-wide association studies for complex traits: consensus, uncertainty and challenges. Nat Rev Genet. 2008;9:356–369. - PubMed
    1. Genome-wide association study of 14,000 cases of seven common diseases and 3,000 shared controls. Nature. 2007;447:661–678. - PMC - PubMed
    1. Easton DF, Pooley KA, Dunning AM, Pharoah PD, Thompson D, et al. Genome-wide association study identifies novel breast cancer susceptibility loci. Nature. 2007;447:1087–1093. - PMC - PubMed
    1. Haiman CA, Patterson N, Freedman ML, Myers SR, Pike MC, et al. Multiple regions within 8q24 independently affect risk for prostate cancer. Nat Genet. 2007;39:638–644. - PMC - PubMed
    1. Plenge RM, Seielstad M, Padyukov L, Lee AT, Remmers EF, et al. TRAF1-C5 as a risk locus for rheumatoid arthritis–a genomewide study. N Engl J Med. 2007;357:1199–1209. - PMC - PubMed

Publication types