. 2008;3(11):e3828.
doi: 10.1371/journal.pone.0003828. Epub 2008 Nov 27.

Acquisition and evolution of plant pathogenesis-associated gene clusters and candidate determinants of tissue-specificity in xanthomonas

Affiliations

Acquisition and evolution of plant pathogenesis-associated gene clusters and candidate determinants of tissue-specificity in xanthomonas

Hong Lu et al. PLoS One. 2008.

Abstract

Background: Xanthomonas is a large genus of plant-associated and plant-pathogenic bacteria. Collectively, members cause diseases on over 392 plant species. Individually, they exhibit marked host- and tissue-specificity. The determinants of this specificity are unknown.

Methodology/principal findings: To assess potential contributions to host- and tissue-specificity, pathogenesis-associated gene clusters were compared across genomes of eight Xanthomonas strains representing vascular or non-vascular pathogens of rice, brassicas, pepper and tomato, and citrus. The gum cluster for extracellular polysaccharide is conserved except for gumN and sequences downstream. The xcs and xps clusters for type II secretion are conserved, except in the rice pathogens, in which xcs is missing. In the otherwise conserved hrp cluster, sequences flanking the core genes for type III secretion vary with respect to insertion sequence element and putative effector gene content. Variation at the rpf (regulation of pathogenicity factors) cluster is more pronounced, though genes with established functional relevance are conserved. A cluster for synthesis of lipopolysaccharide varies highly, suggesting multiple horizontal gene transfers and reassortments, but this variation does not correlate with host- or tissue-specificity. Phylogenetic trees based on amino acid alignments of gum, xps, xcs, hrp, and rpf cluster products generally reflect strain phylogeny. However, amino acid residues at four positions correlate with tissue specificity, revealing hpaA and xpsD as candidate determinants. Examination of genome sequences of xanthomonads Xylella fastidiosa and Stenotrophomonas maltophilia revealed that the hrp, gum, and xcs clusters are recent acquisitions in the Xanthomonas lineage.

Conclusions/significance: Our results provide insight into the ancestral Xanthomonas genome and indicate that differentiation with respect to host- and tissue-specificity involved not major modifications or wholesale exchange of clusters, but subtle changes in a small number of genes or in non-coding sequences, and/or differences outside the clusters, potentially among regulatory targets or secretory substrates.


Conflict of interest statement

Competing Interests: The authors have declared that no competing interests exist.

Figures

Figure 1
Figure 1. Comparison of six clusters of genes involved or implicated in pathogenesis among Xanthomonas strains representing three species and six pathovars.
Sequences of X. oryzae pv. oryzicola strain BLS256 (Xoc), Xanthomonas oryzae pv. oryzae KACC100331 (XooK) and MAFF311018 (XooM), X. axonopodis citri strain 306 (Xac), X. axonopodis pv. vesicatoria strain 85-10 (Xav), X. campestris pv. campestris strains ATCC33913 (XccA) and 8004 (Xcc8), and X. campestris pv. armoraciae strain 756C (Xca) were used. Arrows represent individual genes. For each cluster across genomes, homologs are shown in like colors. Gene identities are given (non-redundantly) above each gene. The blue trace above each cluster represents GC content (window size: 160 bp, step: 40 bp). The black line above each cluster marks the average GC content of the genome, specified below and to the left of the line. Shown for each gene is the percent identity of the predicted product to that of the corresponding gene (if present) in the genome shown at the top. The overall similarity of each cluster to the cluster at the top is given at the near right. The average GC content of each cluster is given at the far right. Where clusters from different strains of the same pathovar are essentially identical, only one is represented. Insertion sequence elements are indicated by red rectangles, tRNA genes by blue triangles and plant-inducible promoter sequences (PIP boxes) by red or blue flags. A red flag represents a perfect PIP box and a blue flag represents an imperfect one. The orientation of the PIP box is represented by the orientation of the flag above or below the cluster. A, the gum gene cluster; B, the xps and xcs gene clusters; C, the hrp gene cluster; D, the rpf gene cluster; E, the lipopolysaccharide biosynthesis gene cluster bordered by the etfA and metB genes.
Figure 2
Figure 2. Relationships across Xanthomonas strains of ribosomal RNA sequences and sequences of pathogenesis-associated gene clusters.
Phylogenetic trees generated as described in Materials and Methods are shown. rrnA, the rrnA operon (nucleotide alignment); gum, GumB through GumJ; xps/xcs, XpsD plus XpsE through XpsN, and XcsD through XpsM plus XpsC; hrp, HpaB through Hpa2; rpf, AcnB through RpfD; etfA-metB, EtfA and MetB, which flank the LPS biosynthetic locus (see Figure 1E). Strain abbreviations are as in the text. Sequence from Xylella fastidiosa 9a–5c was used to root the rrnA tree. Numbers above and below branch points are bootstrap values (as percent) for neighbor-joining with 1000 replicates. Scale represents relative distance as a function of substitutions over time.
Figure 3
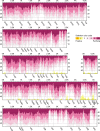
Figure 3. Sequences predicted to be under selection within the gene clusters examined.
Based on the multiple alignments for each cluster, the Ka/Ks score for each codon was calculated with Selecton . Shown is a plot of the Ka/Ks scores across each cluster using a window size of 50 with an offset of 20 residues, drawn using custom software. The vertical scales refer to the number of residues predicted to be under purifying (left) or positive (right) selection in each window. Evidence for selction (Ka/Ks ratios) is color coded, as shown at upper right, with yellow representing evidence of strong positive selection (high Ka/Ks ratio) and purple purifying selection (low Ka/Ks ratio). Raw selecton output for each alignment is available as Data S1.
Figure 4
Figure 4. Inferred pattern of acquisition or loss of five pathogenesis-associated gene clusters in Xanthomonas.
Based on comparison of genome sequences and other data among Xanthomonas strains and the close relatives Xylella fastidiosa and Stenotrophomonas maltophilia (see text), an inferred pattern of acquisition or loss of five pathogenesis associated gene clusters during the evolution of different Xanthomonas lineages is shown, superimposed on a phylogenetic tree drawn from an alignment of 16s rRNA gene sequences. Potential horizontal exchange of hrp and rpf sequences affecting the X. axonopodis clade, discussed in the text, is not depicted. Strain abbreviations are as in the text. For X. fastidiosa, the strain 9a–5c sequence was used. For S. maltophilia, the strain K279a sequence was used.

References

    1. Perna NT, Plunkett G, III, Burland V, Mau B, Glasner JD, et al. Genome sequence of enterohaemorrhagic Escherichia coli O157:H7. Nature. 2001;409:529–533. - PubMed
    1. Parkhill J, Wren BW, Mungall K, Ketley JM, Churcher C, et al. The genome sequence of the food-borne pathogen Campylobacter jejuni reveals hypervariable sequences. Nature. 2000;403:665–668. - PubMed
    1. Deng W, Burland V, Plunkett G, 3rd, Boutin A, Mayhew GF, et al. Genome sequence of Yersinia pestis KIM. J Bacteriol. 2002;184:4601–4611. - PMC - PubMed
    1. Brosch R, Pym AS, Gordon SV, Cole ST. The evolution of mycobacterial pathogenicity: clues from comparative genomics. Trends Microbiol. 2001;9:452–458. - PubMed
    1. Raskin DM, Seshadri R, Pukatzki SU, Mekalanos JJ. Bacterial genomics and pathogen evolution. Cell. 2006;124:703–714. - PubMed

Publication types