. 2008 Nov;124(5):3022-37.
doi: 10.1121/1.2990709.

Auditory brainstem responses to a chirp stimulus designed from derived-band latencies in normal-hearing subjects

Affiliations

Auditory brainstem responses to a chirp stimulus designed from derived-band latencies in normal-hearing subjects

Claus Elberling et al. J Acoust Soc Am. 2008 Nov.

Abstract

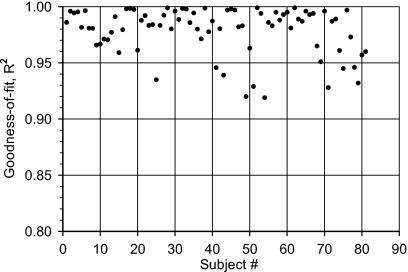
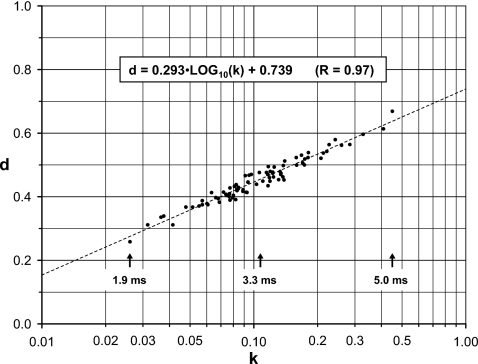
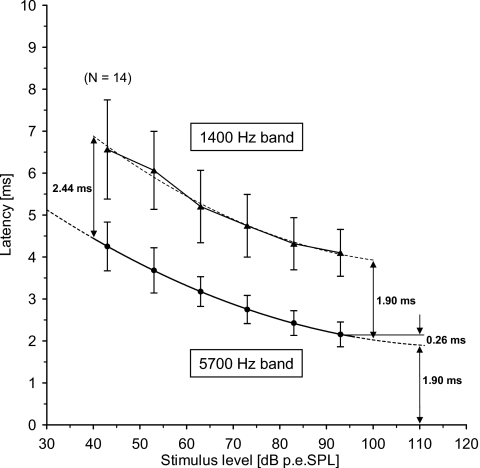
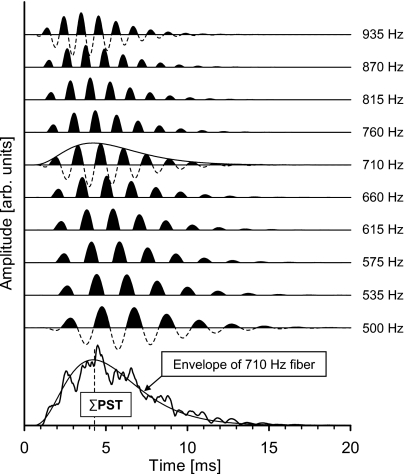
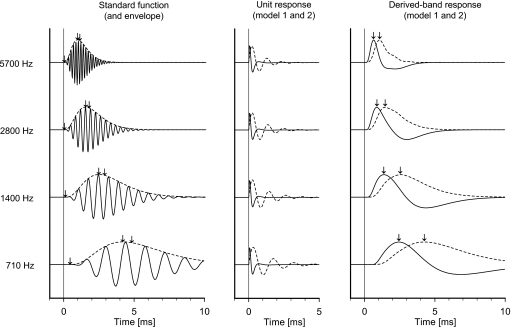
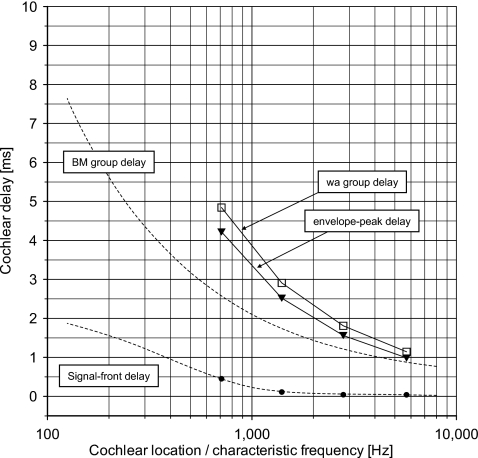
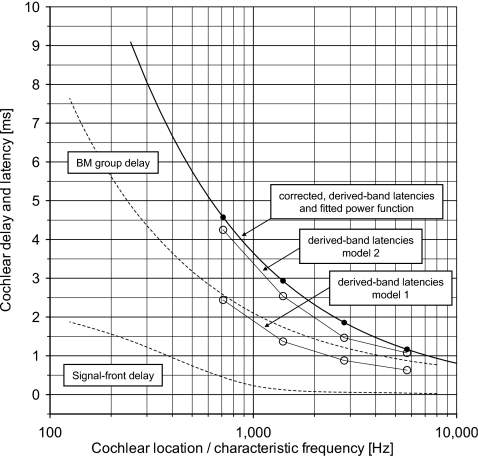
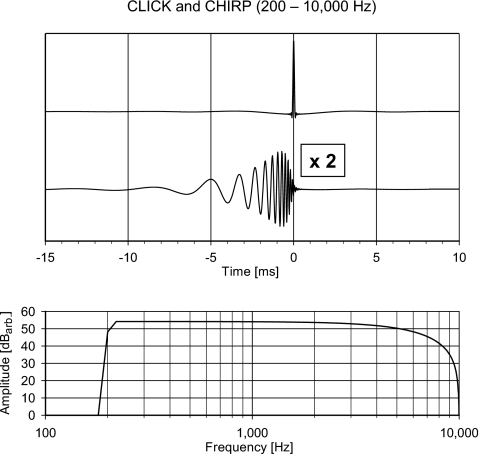
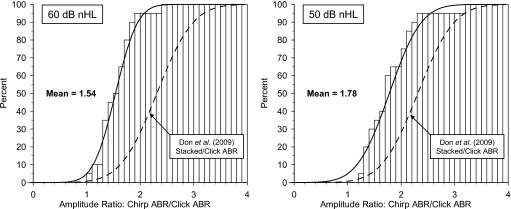
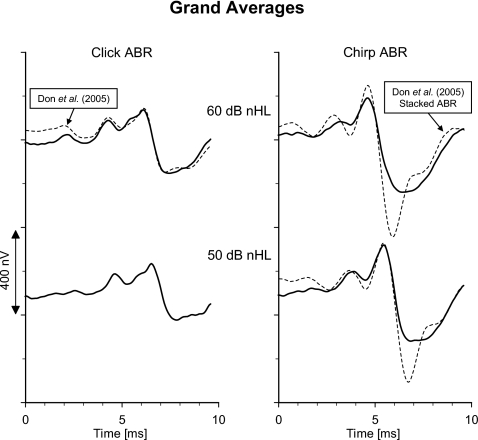
In an attempt to compensate for the temporal dispersion in the human cochlea, a chirp has previously been designed from estimates of the cochlear delay based on derived-band auditory brain-stem response (ABR) latencies [Elberling et al. (2007). "Auditory steady-state responses to chirp stimuli based on cochlear traveling wave delay," J. Acoust. Soc. Am. 122, 2772-2785]. To evaluate intersubject variability and level effects of such delay estimates, a large dataset is analyzed from 81 normal-hearing adults (fixed click level) and from a subset thereof (different click levels). At a fixed click level, the latency difference between 5700 and 710 Hz ranges from about 2.0 to 5.0 ms, but over a range of 60 dB, the mean relative delay is almost constant. Modeling experiments demonstrate that the derived-band latencies depend on the cochlear filter buildup time and on the unit response waveform. Because these quantities are partly unknown, the relationship between the derived-band latencies and the basilar membrane group delay cannot be specified. A chirp based on the above delay estimates is used to record ABRs in ten normal-hearing adults (20 ears). For levels below 60 dB nHL, the gain in amplitude of chirp-ABRs to click-ABRs approaches 2, and the effectiveness of chirp-ABRs compares favorably to Stacked-ABRs obtained under similar conditions.


Figures

Figure 1
Figure 1
Distribution across subjects of the goodness of fit (R2) obtained by fitting the corrected derived-band latencies from each individual to a power-function model (N=81 Ss).
Figure 2
Figure 2
Paired values of the two parameters, k and d, which define the power-function model [Eq. 1] fitted to the corrected derived-band latencies from each individual (N=81 Ss). With k plotted on a logarithmic axis, there appears to be a linear relationship between d and k (indicated by the formula and the corresponding plotted broken line; R=0.97). The locations of the mean and the two end points of the distribution (k,d) are shown by the arrows together with the corresponding latency differences between the 5700 and 710 Hz derived bands.
Figure 3
Figure 3
Latencies (mean and ± one standard deviation) for the 5700 and 1400 Hz derived bands plotted as a function of click level (Table 2). The mean values for the 5700 and the 1400 Hz derived bands are each fitted to a second-order polynomial, shown by the broken lines. The polynomial for the 5700 Hz band indicates that the latency in this band flattens off at about 110 dB p.-p.e.SPL with a value of 1.90 ms; this latency is 0.26 ms shorter than the observed mean value at 93 dB p.-p.e.SPL. The latency delay between the two bands estimated from the two fitted polynomials is 1.90 ms at 100 dB p.-p.e.SPL, and 2.44 ms at 40 dB p.-p.e.SPL.
Figure 4
Figure 4
(Top) Simulated activity from ten single nerve fibers, i.e., standard functions (de Boer, 1975) uniformly distributed on a logarithmic frequency scale of the low-frequency octave band. The neural activity or simulated PST histograms is indicated by the black areas. Each standard function is given a signal-front delay corresponding to the values estimated by Ruggero and Temchin (2007) and plotted in Figs. 67. (Bottom) The sum of the PST histograms (ΣPST) across the octave band (irregular curve). A scaled version of the temporal envelope of the standard function for the 710 Hz nerve fiber (the geometrical center frequency of the band) is plotted for comparison. The broken vertical line corresponds to the peak latency (4.3 ms) of the 710 Hz envelope.
Figure 5
Figure 5
(Left) Standard functions and envelopes (de Boer, 1975) corresponding to the center frequency of each of the four derived bands. The arrows indicate (left to right) the signal front delay, the envelope-peak delay, and the weighted-average group delay (see Appendix A); these latencies are plotted in Fig. 6. (Middle) Unit responses in accordance with models 1 (—) and 2 (- - -) (see Appendix B). (Right) Modeled derived-band responses obtained by convolution of the standard function envelopes (left) with each of the two unit responses (middle). The arrows indicate the peak latencies of the modeled derived-band responses; these latencies are plotted in Fig. 7.
Figure 6
Figure 6
Cochlear delay vs. cochlear location indicated by characteristic frequency. The broken lines show the signal front delay and the group delay of the BM estimated to be valid for humans at intense levels of stimulation by Ruggero and Temchin (2007, Fig. 7). The following delay values of the standard functions in Fig. 5 are shown: the signal front delay (●), the envelope-peak delay (▾), and the calculated weighted-average group delay (◻).
Figure 7
Figure 7
Cochlear delay and latency vs cochlear location indicated by characteristic frequency. The broken lines show the signal front delay and the group delay of the BM estimated to be valid for humans at intense levels of stimulation by Ruggero and Temchin (2007, Fig. 7). The figure shows the corrected derived-band latencies (●) (Table 1, last column) and the corresponding fitted power-function model (full line). The peak latencies (○) of the two sets of modeled derived-band responses (models 1 and 2; Fig. 5, right) are also included.
Figure 8
Figure 8
(Top) The temporal waveform of the click and the chirp. The stimuli are band limited to the frequency range from 200 to 10 000 Hz. The amplitude of the chirp has been multiplied by 2. The two stimuli are temporally aligned so the phase delay at 10 000 Hz of both stimuli corresponds to 0 ms. (Bottom) The (identical) amplitude spectra of the two stimuli. The lower cutoff corresponds to −6 dB at 200 Hz and the higher cutoff corresponds to the falling spectrum of a 100 μs click, having its first null at 10 000 Hz (see endnote 5).
Figure 9
Figure 9
Cumulative distribution of the ratios between the chirp and the click ABR amplitudes (N=20 ears) obtained at 60 dB nHL (left, mean value=1.54) and at 50 dB nHL (right, mean value=1.78). Both the observed distribution of the individual amplitude ratios and the corresponding continuous Gaussian distribution using the observed mean and standard deviation (Table 3) are shown. The continuous Gaussian distribution of the ratios between the modeled Stacked and the click ABR amplitudes obtained at 60 dB nHL by Don et al. 2009 [Fig. 1(c)] are shown for comparison (broken line).
Figure 10
Figure 10
Grand average waveforms of click ABR (left) and chirp ABR (right) obtained at 60 and 50 dB nHL (N=20 ears). The corresponding grand averages of the click ABR and the modeled Stacked ABR obtained from the original recordings at 60 dB nHL by Don et al. (2005) are shown for comparison (broken lines): left, click ABR; right, modeled Stacked ABR. These latter waveforms are scaled and time shifted as described in detail in the text.

References

    1. Anderson, D. J., Rose, J. E., Hind, J. E., and Brugge, J. F. (1971). “Temporal position of discharges in single auditory nerve fibers within the cycle of a sine-wave stimulus: frequency and intensity effects,” J. Acoust. Soc. Am. JASMAN10.1121/1.1912474 49, 1131–1139. - DOI - PubMed
    1. Chertoff, M. E. (2004). “Analytic treatment of the compound action potential: Estimating the summed post-stimulus time histogram and unit response,” J. Acoust. Soc. Am. JASMAN10.1121/1.1791911 116, 3022–3030. - DOI - PubMed
    1. Dau, T., Wagner, O., Mellert, V., and Kollmeier, B. (2000). “Auditory brainstem responses with optimized chirp signals compensating basilar membrane dispersion,” J. Acoust. Soc. Am. JASMAN10.1121/1.428438 107, 1530–1540. - DOI - PubMed
    1. de Boer, E. (1967). “Correlation studies applied to the frequency resolution of the cochlea,” J. Aud Res. ZZZZZZ 7, 209–217.
    1. de Boer, E. (1975). “Synthetic whole-nerve action potentials for the cat,” J. Acoust. Soc. Am. JASMAN10.1121/1.380762 58, 1030–1045. - DOI - PubMed

Publication types