. 2008 Dec;34(6):1441-63.
doi: 10.1037/a0012320.

Where similarity beats redundancy: the importance of context, higher order similarity, and response assignment

Affiliations

Where similarity beats redundancy: the importance of context, higher order similarity, and response assignment

Ami Eidels et al. J Exp Psychol Hum Percept Perform. 2008 Dec.

Erratum in

  • J Exp Psychol Hum Percept Perform. 2009 Feb;35(1):169

Abstract

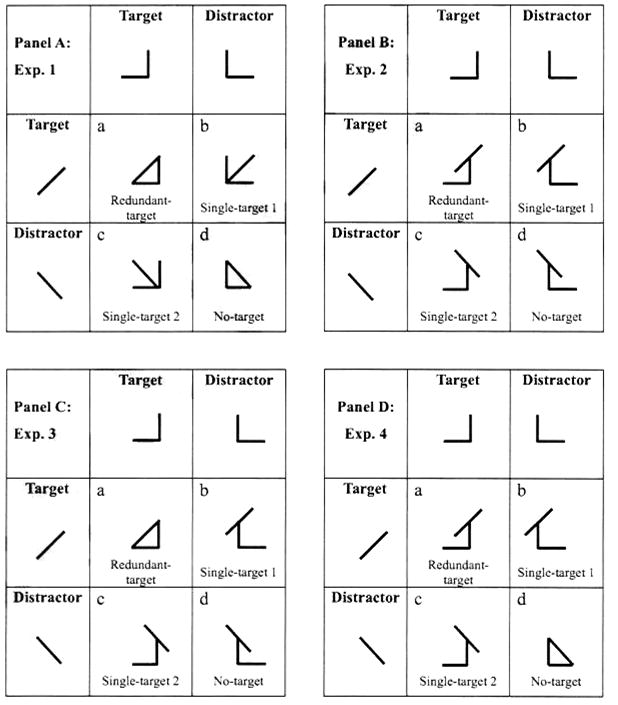
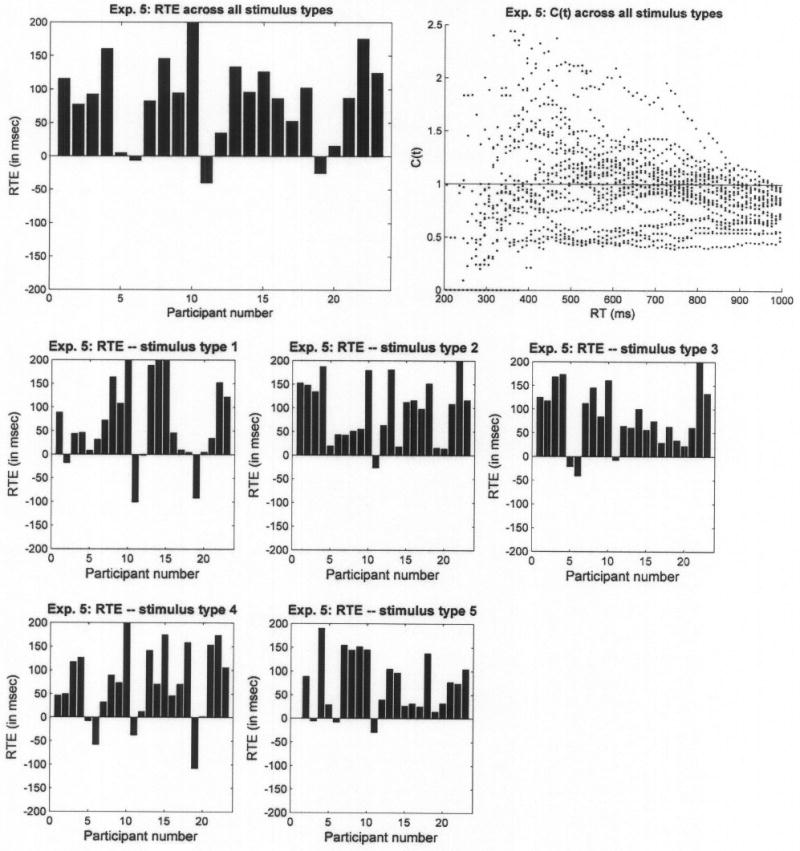
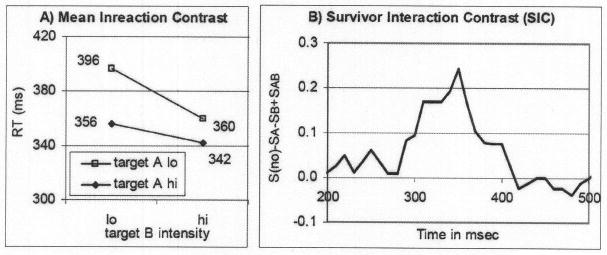
People are especially efficient in processing certain visual stimuli such as human faces or good configurations. It has been suggested that topology and geometry play important roles in configural perception. Visual search is one area in which configurality seems to matter. When either of 2 target features leads to a correct response and the sequence includes trials in which either or both targets are present, the result is a redundant-target paradigm. It is common for such experiments to find faster performance with the double target than with either alone, something that is difficult to explain with ordinary serial models. This redundant-targets study uses figures that can be dissimilar in their topology and geometry and manipulates the stimulus set and the stimulus?response assignments. The authors found that the combination of higher order similarity (e.g., topological) among the features in the stimulus set and response assignment can effectively overpower or facilitate the redundant-target effect, depending on the exact nature of the former characteristics. Several reasonable models of redundant-targets performance are falsified. Parallel models with the potential for channel interactions are supported by the data.


Figures

Figure 1
Figure 1
An example of the stimuli used by Pomerantz et al. (1977) to produce a configural superiority effect. When participants had to localize the odd item in the original display (A), it took them 1,884 ms. When an informationless context (B) was superimposed on the original display, thus creating a new set (C), response times were reduced to as little as 749 ms.
Figure 2
Figure 2
Detecting the odd item in the composite display (C, with context) is easier than in the original display (A, four rings, no context added), presumably because of the topological difference—that is, number of holes—between the odd item and the three completely black discs (Pomerantz, 2003).
Figure 3
Figure 3
The stimulus sets used in Experiments 1–4 (A–D, respectively). Each stimulus, in each of the experiments, was made up of a diagonal line (left–right) and an └ (normal–mirror image). For each component, one value was defined as a target and the other as a distractor, such that when combined factorially they produced redundant-target (a), single-target (b and c), and no-target (d) displays. Given that the task was target detection, the stimuli in Quadrants a, b, and c call for a “yes” response, whereas the stimulus in Quadrant d calls for a “no” response.
Figure 4
Figure 4
Results of Experiment 1. The left panel presents the redundant-target effect (RTE) calculated individually, with each bar corresponding to a single participant. The middle panel presents C(t) values pooled across participants. The right panel presents the Miller and Grice bounds for a typical participant (P1). The uppermost dashed line is the calculated (not observed) cumulative distribution function (CDF) for the sum of the two single-target CDFs, which serves as Miller's bound; if the redundant-target CDF exceeds this line, then the Miller inequality is violated. Violations of the lower, Grice, bound occur if the redundant-target CDF goes below the CDF of the faster of the two single-target conditions. The Miller inequality was not violated at any point t, whereas the Grice inequality was violated across almost the whole time range.
Figure 5
Figure 5
Results of Experiment 2. The left panel presents individual redundant target effects (RTEs), where each bar corresponds to a single participant. The middle panel presents C(t) values pooled across participants. The left panel presents the Miller and Grice bounds for a typical participant (P3). The observed cumulative distribution function (CDF) for the redundant-target condition lies between the two bounds, suggesting that capacity was neither limited nor super.
Figure 6
Figure 6
Results of Experiments 3 and 4. The left panels present redundant-target effects (RTEs) calculated individually, with each bar corresponding to a single participant. The right panels presents C(t) values pooled across participants.
Figure 7
Figure 7
The stimulus set used in Experiment 5. As in the previous experiments, the redundant-target (a) and single-target (b and c) displays call for a “yes” response, whereas the no-target display (d) calls for a “no” response. The basic features of line and angle could be combined together in one of five spatial arrangements (stimulus types).
Figure 8
Figure 8
Redundant-target effect (RTE) and capacity coefficient, C(t), for Experiment 5. The upper left panel presents individual RTEs, where each bar corresponds to a single participant. The upper right panel presents C(t) values pooled across participants. The lower panels present RTEs calculated separately for each stimulus type.
Figure 9
Figure 9
Capacity coefficient, C(t), calculated separately for each stimulus type (Experiment 5, Participant 27). Panel A illustrates the C(t) function for Stimulus Type 1, and Panel B illustrates the C(t) function for Stimulus Type 2 (both stimulus classes are presented in Figure 10).
Figure 10
Figure 10
Mean interaction contrast (MIC; A) and survivor interaction contrast (SIC; B) plots for a typical participant in the auxiliary experiment, where the targets (line, angle) were spatially separated. The overadditive MIC and the entirely positive SIC suggest that the line and angle targets were processed in parallel, with a minimum-time stopping rule.

References

    1. Ashby FG, Townsend JT. Varieties of perceptual independence. Psychological Review. 1986;93:154–179. - PubMed
    1. Chen L. The topological approach to perceptual organization. Visual Cognition. 2005;12:553–637.
    1. Chen L, Zhang S, Srinivasan MV. Global perception in small brains: Topological pattern recognition in honey bees. Proceedings of the National Academy of Sciences, USA. 2003;100:6884–6889. - PMC - PubMed
    1. Clark HH, Chase WG. On the process of comparing sentences against pictures. Cognitive Psychology. 1972;3:472–517.
    1. Colonius H, Townsend JT. Activation-state representation of models for the redundant-signals effect. In: Marley AAJ, editor. Choice, decision and measurement: Volume in honor of R Duncan Luce. Mahwah, NJ: Erlbaum; 1997. pp. 245–254.

Publication types